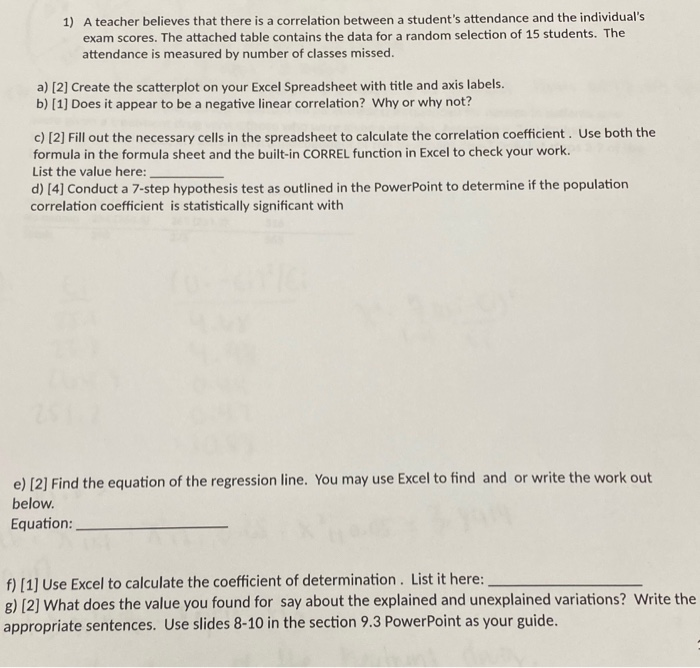
Question: 1) A teacher believes that there is a correlation between a student's attendance and the individual's exam scores. The attached table contains the data for

1) A teacher believes that there is a correlation
1) A teacher believes that there is a correlation between a student's attendance and the individual's exam scores. The attached table contains the data for a random selection of 15 students. The attendance is measured by number of classes missed. a) [2] Create the scatterplot on your Excel Spreadsheet with title and axis labels. b) [1] Does it appear to be a negative linear correlation? Why or why not? c) [2] Fill out the necessary cells in the spreadsheet to calculate the correlation coefficient. Use both the formula in the formula sheet and the built-in CORREL function in Excel to check your work. List the value here: d) [4] Conduct a 7-step hypothesis test as outlined in the PowerPoint to determine if the population correlation coefficient is statistically significant with e) (2) Find the equation of the regression line. You may use Excel to find and or write the work out below. Equation: f) [1] Use Excel to calculate the coefficient of determination. List it here: 8) [2] What does the value you found for say about the explained and unexplained variations? Write the appropriate sentences. Use slides 8-10 in the section 9.3 PowerPoint as your guide. 1) A teacher believes that there is a correlation between a student's attendance and the individual's exam scores. The attached table contains the data for a random selection of 15 students. The attendance is measured by number of classes missed. a) [2] Create the scatterplot on your Excel Spreadsheet with title and axis labels. b) [1] Does it appear to be a negative linear correlation? Why or why not? c) [2] Fill out the necessary cells in the spreadsheet to calculate the correlation coefficient. Use both the formula in the formula sheet and the built-in CORREL function in Excel to check your work. List the value here: d) [4] Conduct a 7-step hypothesis test as outlined in the PowerPoint to determine if the population correlation coefficient is statistically significant with e) (2) Find the equation of the regression line. You may use Excel to find and or write the work out below. Equation: f) [1] Use Excel to calculate the coefficient of determination. List it here: 8) [2] What does the value you found for say about the explained and unexplained variations? Write the appropriate sentences. Use slides 8-10 in the section 9.3 PowerPoint as your guide

Step by Step Solution

There are 3 Steps involved in it

1 Expert Approved Answer
Step: 1 Unlock blur-text-image
Question Has Been Solved by an Expert!

Get step-by-step solutions from verified subject matter experts

Step: 2 Unlock
Step: 3 Unlock

Students Have Also Explored These Related General Management Questions!