

Question: 1) a) The normal and crash times for each activity are shown in the table below. It is required to compute the different minimum
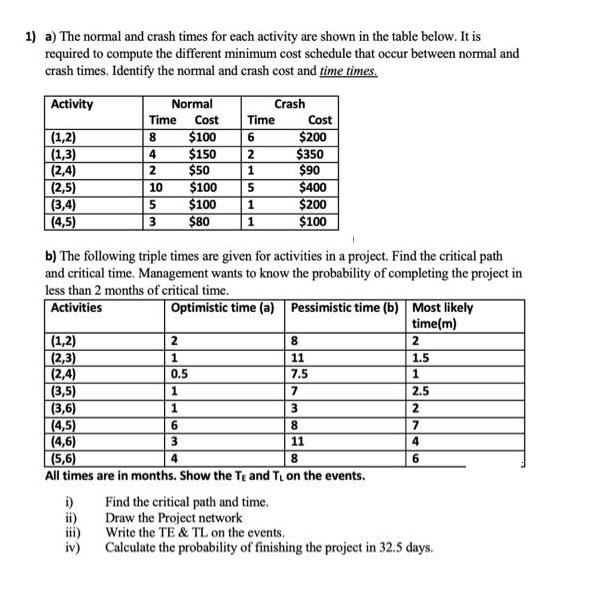
1) a) The normal and crash times for each activity are shown in the table below. It is required to compute the different minimum cost schedule that occur between normal and crash times. Identify the normal and crash cost and time times. Activity (1,2) (1,3) (2,4) (2,5) (3,4) (4,5) (1,2) (2,3) (2,4) (3,5) (3,6) (4,5) (4,6) (5,6) Time 8 4 2 10 5 i) ii) Normal 3 2 1 0.5 1 Cost $100 $150 $50 1 6 3 4 $100 $100 $80 Crash Time 6 2 1 5 1 1 b) The following triple times are given for activities in a project. Find the critical path and critical time. Management wants to know the probability of completing the project in less than 2 months of critical time. Activities Optimistic time (a) Pessimistic time (b) Cost $200 $350 $90 $400 $200 $100 8 11 7.5 7 3 8 11 8 All times are in months. Show the Te and T on the events. Most likely time(m) 2 1.5 1 2.5 2 7 4 6 Find the critical path and time. Draw the Project network Write the TE & TL on the events. Calculate the probability of finishing the project in 32.5 days.
Step by Step Solution
3.45 Rating (161 Votes )
There are 3 Steps involved in it
ojo A B according to given data possible path 125 1245 1345 14 ... View full answer

Get step-by-step solutions from verified subject matter experts