

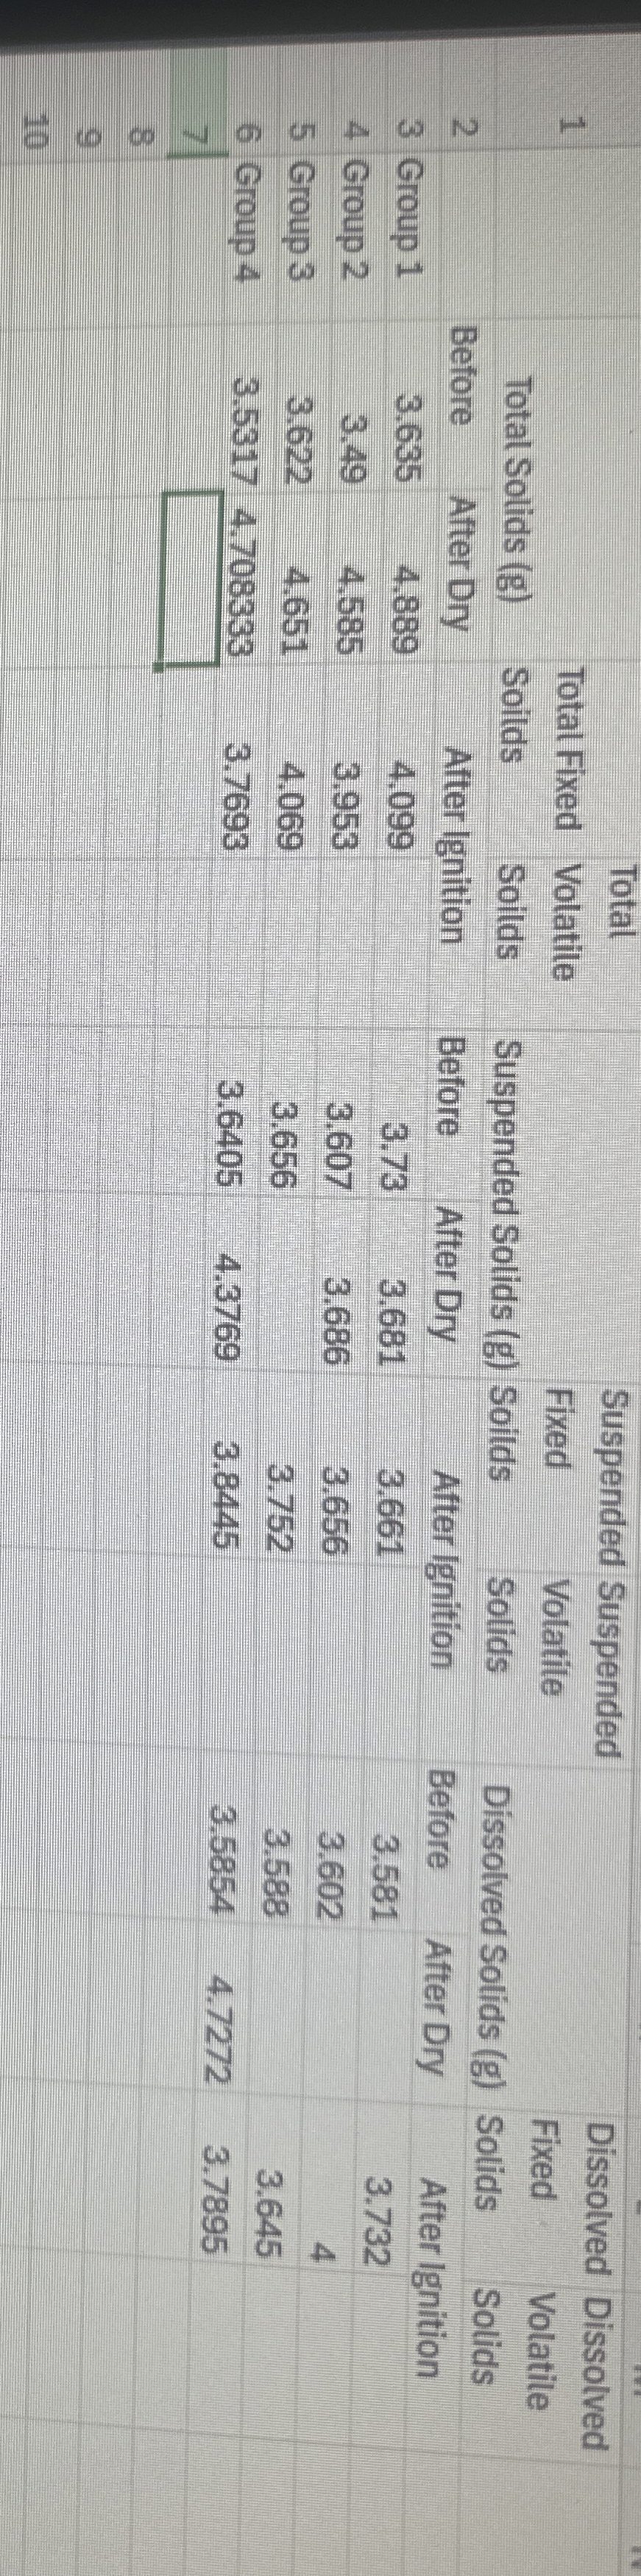
Question: 1 A ) Using experimental data, find the following for each parameter represented on the data sheet ( ies TS before drying, TS after drying,
A Using experimental data, find the following for each parameter represented on the data sheet ies TS before drying, TS after drying, TS after igniting, etcc Name of person who completed
Mean
Standard deviation
Confidence Limit High End
Confidence Limit Low End
tableMean,tableStandardDeviationtable ConfidenceLimit High Endtable ConfidenceLimit Low EndTS before drying,,,,TS after drying,,,,TS after igniting,,,,SS before drying,,,,SS after dyyngSS after igniting,,,,DS before dyying,,,,DS affer drying,,,,DS affer igniting,,,,
B What values for the calculation inputs below did you use for the calculations above? Name of person who completed
Degrees of freetom
factor for Confidence Interval
Step by Step Solution
There are 3 Steps involved in it
1 Expert Approved Answer
Step: 1 Unlock

Question Has Been Solved by an Expert!
Get step-by-step solutions from verified subject matter experts
Step: 2 Unlock
Step: 3 Unlock