

Question: 1. After completing the Aggregate Planning Template for the data provided in the template (name the worksheet DEMO), make a copy of that worksheet (in
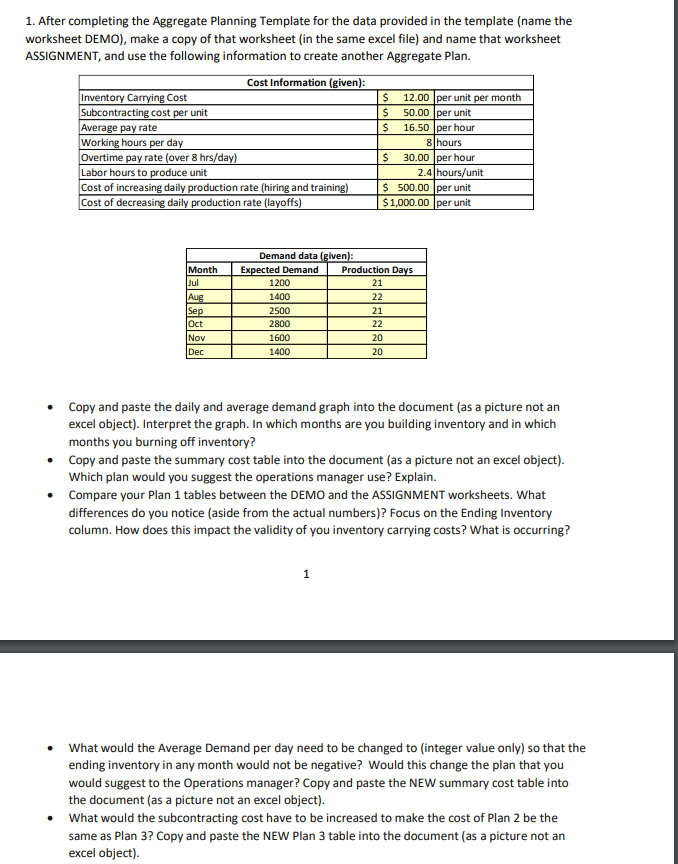
1. After completing the Aggregate Planning Template for the data provided in the template (name the worksheet DEMO), make a copy of that worksheet (in the same excel file) and name that worksheet ASSIGNMENT, and use the following information to create another Aggregate Plan. Cost Information (given): Inventory Carrying Cost $ 12.00 per unit per month Subcontracting cost per unit $ 50.00 per unit Average pay rate $ 16.50 per hour Working hours per day 8 hours Overtime pay rate (over 8 hrs/day) $ 30.00 per hour Labor hours to produce unit 2.4 hours/unit Cost of increasing daily production rate (hiring and training) $ 500.00 per unit Cost of decreasing daily production rate (layoffs) $1,000.00 per unit Month Jul Aug Sep Oct Nov Dec Demand data (glven): Expected Demand Production Days 1200 21 1400 22 2500 21 2800 22 1600 20 1400 20 Copy and paste the daily and average demand graph into the document (as a picture not an excel object). Interpret the graph. In which months are you building inventory and in which months you burning off inventory? Copy and paste the summary cost table into the document (as a picture not an excel object). Which plan would you suggest the operations manager use? Explain. Compare your Plan 1 tables between the DEMO and the ASSIGNMENT worksheets. What differences do you notice (aside from the actual numbers)? Focus on the Ending Inventory column. How does this impact the validity of you inventory carrying costs? What is occurring? 1 What would the Average Demand per day need to be changed to integer value only) so that the ending inventory in any month would not be negative? Would this change the plan that you would suggest to the Operations manager? Copy and paste the NEW summary cost table into the document (as a picture not an excel object). What would the subcontracting cost have to be increased to make the cost of Plan 2 be the same as Plan 3? Copy and paste the NEW Plan 3 table into the document (as a picture not an excel object) 1. After completing the Aggregate Planning Template for the data provided in the template (name the worksheet DEMO), make a copy of that worksheet (in the same excel file) and name that worksheet ASSIGNMENT, and use the following information to create another Aggregate Plan. Cost Information (given): Inventory Carrying Cost $ 12.00 per unit per month Subcontracting cost per unit $ 50.00 per unit Average pay rate $ 16.50 per hour Working hours per day 8 hours Overtime pay rate (over 8 hrs/day) $ 30.00 per hour Labor hours to produce unit 2.4 hours/unit Cost of increasing daily production rate (hiring and training) $ 500.00 per unit Cost of decreasing daily production rate (layoffs) $1,000.00 per unit Month Jul Aug Sep Oct Nov Dec Demand data (glven): Expected Demand Production Days 1200 21 1400 22 2500 21 2800 22 1600 20 1400 20 Copy and paste the daily and average demand graph into the document (as a picture not an excel object). Interpret the graph. In which months are you building inventory and in which months you burning off inventory? Copy and paste the summary cost table into the document (as a picture not an excel object). Which plan would you suggest the operations manager use? Explain. Compare your Plan 1 tables between the DEMO and the ASSIGNMENT worksheets. What differences do you notice (aside from the actual numbers)? Focus on the Ending Inventory column. How does this impact the validity of you inventory carrying costs? What is occurring? 1 What would the Average Demand per day need to be changed to integer value only) so that the ending inventory in any month would not be negative? Would this change the plan that you would suggest to the Operations manager? Copy and paste the NEW summary cost table into the document (as a picture not an excel object). What would the subcontracting cost have to be increased to make the cost of Plan 2 be the same as Plan 3? Copy and paste the NEW Plan 3 table into the document (as a picture not an excel object)
Step by Step Solution
There are 3 Steps involved in it

Get step-by-step solutions from verified subject matter experts