

Question: 1. An inspector wants to develop 3 sigma level process control charts to monitor the weight of bag of rocks. Data (in pounds) from
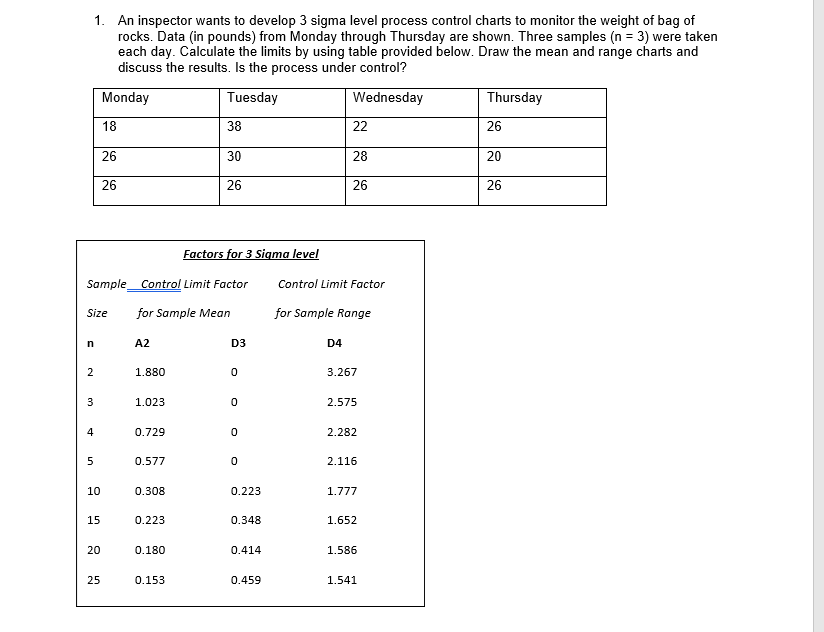
1. An inspector wants to develop 3 sigma level process control charts to monitor the weight of bag of rocks. Data (in pounds) from Monday through Thursday are shown. Three samples (n = 3) were taken each day. Calculate the limits by using table provided below. Draw the mean and range charts and discuss the results. Is the process under control? Monday Tuesday Wednesday Thursday 18 38 22 26 26 30 28 20 26 26 26 26 Factors for 3 Sigma level Sample Control Limit Factor Control Limit Factor Size for Sample Mean for Sample Range n A2 D3 D4 2 1.880 0 3.267 3 1.023 0 2.575 4 0.729 0 2.282 5 0.577 0 2.116 10 0.308 0.223 1.777 15 0.223 0.348 1.652 20 0.180 0.414 1.586 25 0.153 0.459 1.541
Step by Step Solution
There are 3 Steps involved in it

Get step-by-step solutions from verified subject matter experts