

Question: 1. Analyze a mixed cost using o scattergraph plot and the hightow method. 2 orepore income stetements for a merchend sing comperfy using the traditional
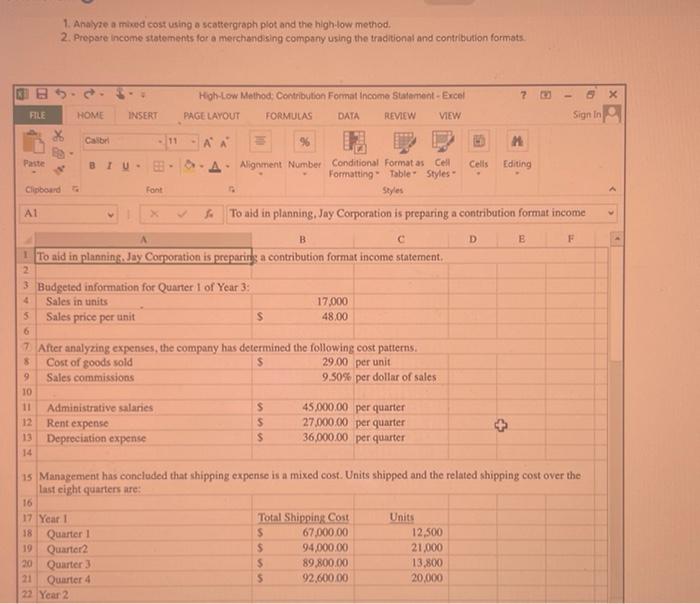
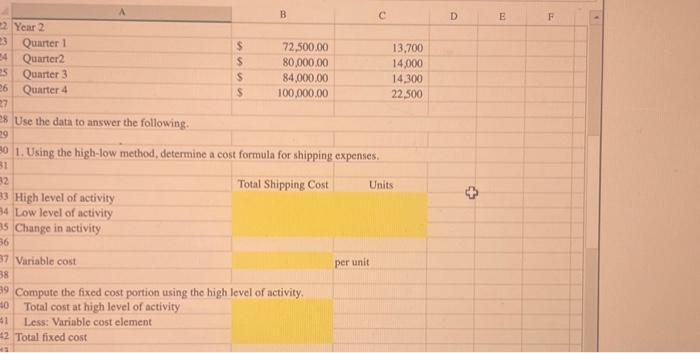
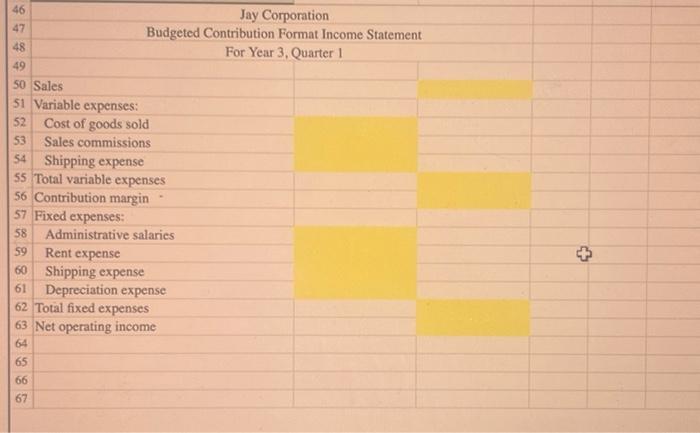
1. Analyze a mixed cost using o scattergraph plot and the hightow method. 2 orepore income stetements for a merchend sing comperfy using the traditional and contribution formats \begin{tabular}{|l|l|l|} \hline 46 & \multicolumn{2}{|c|}{ Jay Corporation } \\ \hline 47 & Fudgeted Contribution Format Income Statement \\ \hline 49 & For Year 3, Quarter 1 \\ \hline 50 & Sales \\ \hline 51 & Variable expenses: \\ \hline 52 & Cost of goods sold \\ \hline 53 & Sales commissions \\ \hline 54 & Shipping expense \\ \hline 55 & Total variable expenses \\ \hline 56 & Contribution margin \\ \hline 57 & Fixed expenses: \\ \hline 58 & Administrative salaries \\ \hline 59 & Rent expense \\ \hline 60 & Shipping expense \\ \hline 61 & Depreciation expense \\ \hline 62 & Total fixed expenses \\ \hline 63 & Net operating income \\ \hline 64 & & \\ \hline 65 & & \\ \hline 66 & & \\ \hline 67 & & \\ \hline \end{tabular}
Step by Step Solution
There are 3 Steps involved in it

Get step-by-step solutions from verified subject matter experts