1. Annual Demand for product XYZ at a warehouse of a manufacturing facility is about 10,010 units....
Question:
- 1. Annual Demand for product XYZ at a warehouse of a manufacturing facility is about 10,010 units. The company opens 254 days per year and finds that its supplier delivery takes in average 5 working days.
- What would be the reordering point if demand and supply do not vary?
- What would be the reorder point if you want to provide a service level of about 80% knowing that standard deviation of the daily demand during lead time is about 3 units?
- A supply company sells a product for which annual demand is 5000 boxes and the company opens 365 days per year. At the moment it is paying $ 7.50 for each box. Carrying cost is 25% of the unit cost; ordering cost is $35.
- If the supplier desires to order the optimal amount, what amount would you tell the company to order?
- What would be the number of orders in a year?
- If an order take about three days to arrive, how many units should there be in inventory when you place an order.
- What would be the time between orders?
- For the following products, use ABC analysis to determine which items need to carefully be controlled using quantitative inventory techniques and which items should not be closely controlled.
Product | Unit cost($) | Annual Demand (units) |
1 2 3 4 5 6 | 5.84 5.40 1.12 74.54 2.0 2.08 | 1200 1110 896 1104 1110 961 |
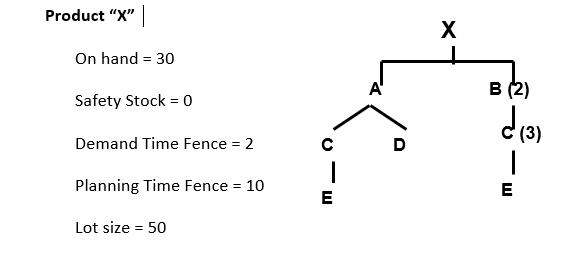
- 2. Product “ABC” has the product structure given below. In addition, relevant details for each component are given.
- Complete the Master Schedule and create MRP records for each of the components.
- Suppose the supplier for the 600 part “C” scheduled for week 1 notifies you that an equipment problem will prevent them from shipping the parts until week 3. What are the implications? Describe ALL possible options open to you in this case.
 Please submit your work properly organized. Use the following format.
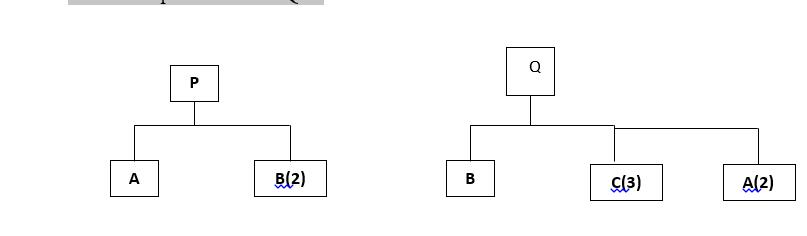
- 3. Given the following bills of material and routing information, develop capacity bills for each of the products P and Q:
Week | 1 | 2 | 3 | 4 | 5 | 6 | 7 | 8 | 9 | 10 | 11 |
Gross Requirements | |||||||||||
Scheduled Receipts | |||||||||||
Proj. ending inv. | |||||||||||
Net Requirements | |||||||||||
Planned Receipts | |||||||||||
Planned Order Releases | |||||||||||
Service Requirements | |||||||||||
Item | Work Center | Lot Size | Operation | Setup (Hrs) | Run (Hrs per unit) |
P | 10 | 30 | 1 of 1 | 1.2 | 0.43 |
Q | 10 | 50 | 1 of 1 | 0.6 | 0.57 |
A | 20 | 60 | 1 of 2 | 0.8 | 0.18 |
A | 30 | 60 | 2 of 2 | 0.9 | 0.33 |
B | 20 | 80 | 1 of 1 | 1.3 | 0.19 |
C | 20 | 50 | 1 of 2 | 2.1 | 0.22 |
C | 30 | 50 | 2 of 2 | 0.8 | 0.09 |
3.1) .The following Input/Output report was prepared for a work center with a beginning backlog of 25 hours:
Week | 1 | 2 | 3 | 4 | 5 | 6 |
Planned Input (hrs.) | 50 | 50 | 50 | 55 | 55 | 55 |
Actual Input (hrs.) | 57 | 53 | 51 | 56 | 53 | 59 |
Cumulative Deviation |
Planned Output (hrs.) | 60 | 55 | 55 | 55 | 55 | 55 |
Actual Output (hrs.) | 53 | 51 | 54 | 56 | 52 | 58 |
Cumulative Deviation |
Actual Backlog |
a) Complete the Input/Output report for the center
b) Do you see any trend in numbers? Backlog? Explain.
Expert Answer:
Sure here are the answers to the questions Inventory Management Reordering Point The reordering point is the inventory level that triggers a new order to be placed It is calculated as follows Reorderi... View the full answer