

Question: 1. Answer choices- x bar, 2. Answer choices- s^2, ^2, s, 3. Answer choices- , ^2, s, s^24. Answer choices- symmetric, negatively skewed, positively skewed
1. Answer choices- x bar, 2. Answer choices- s^2, ^2, s, 3. Answer choices- , ^2, s, s^24. Answer choices- symmetric, negatively skewed, positively skewed Please help me answer questions
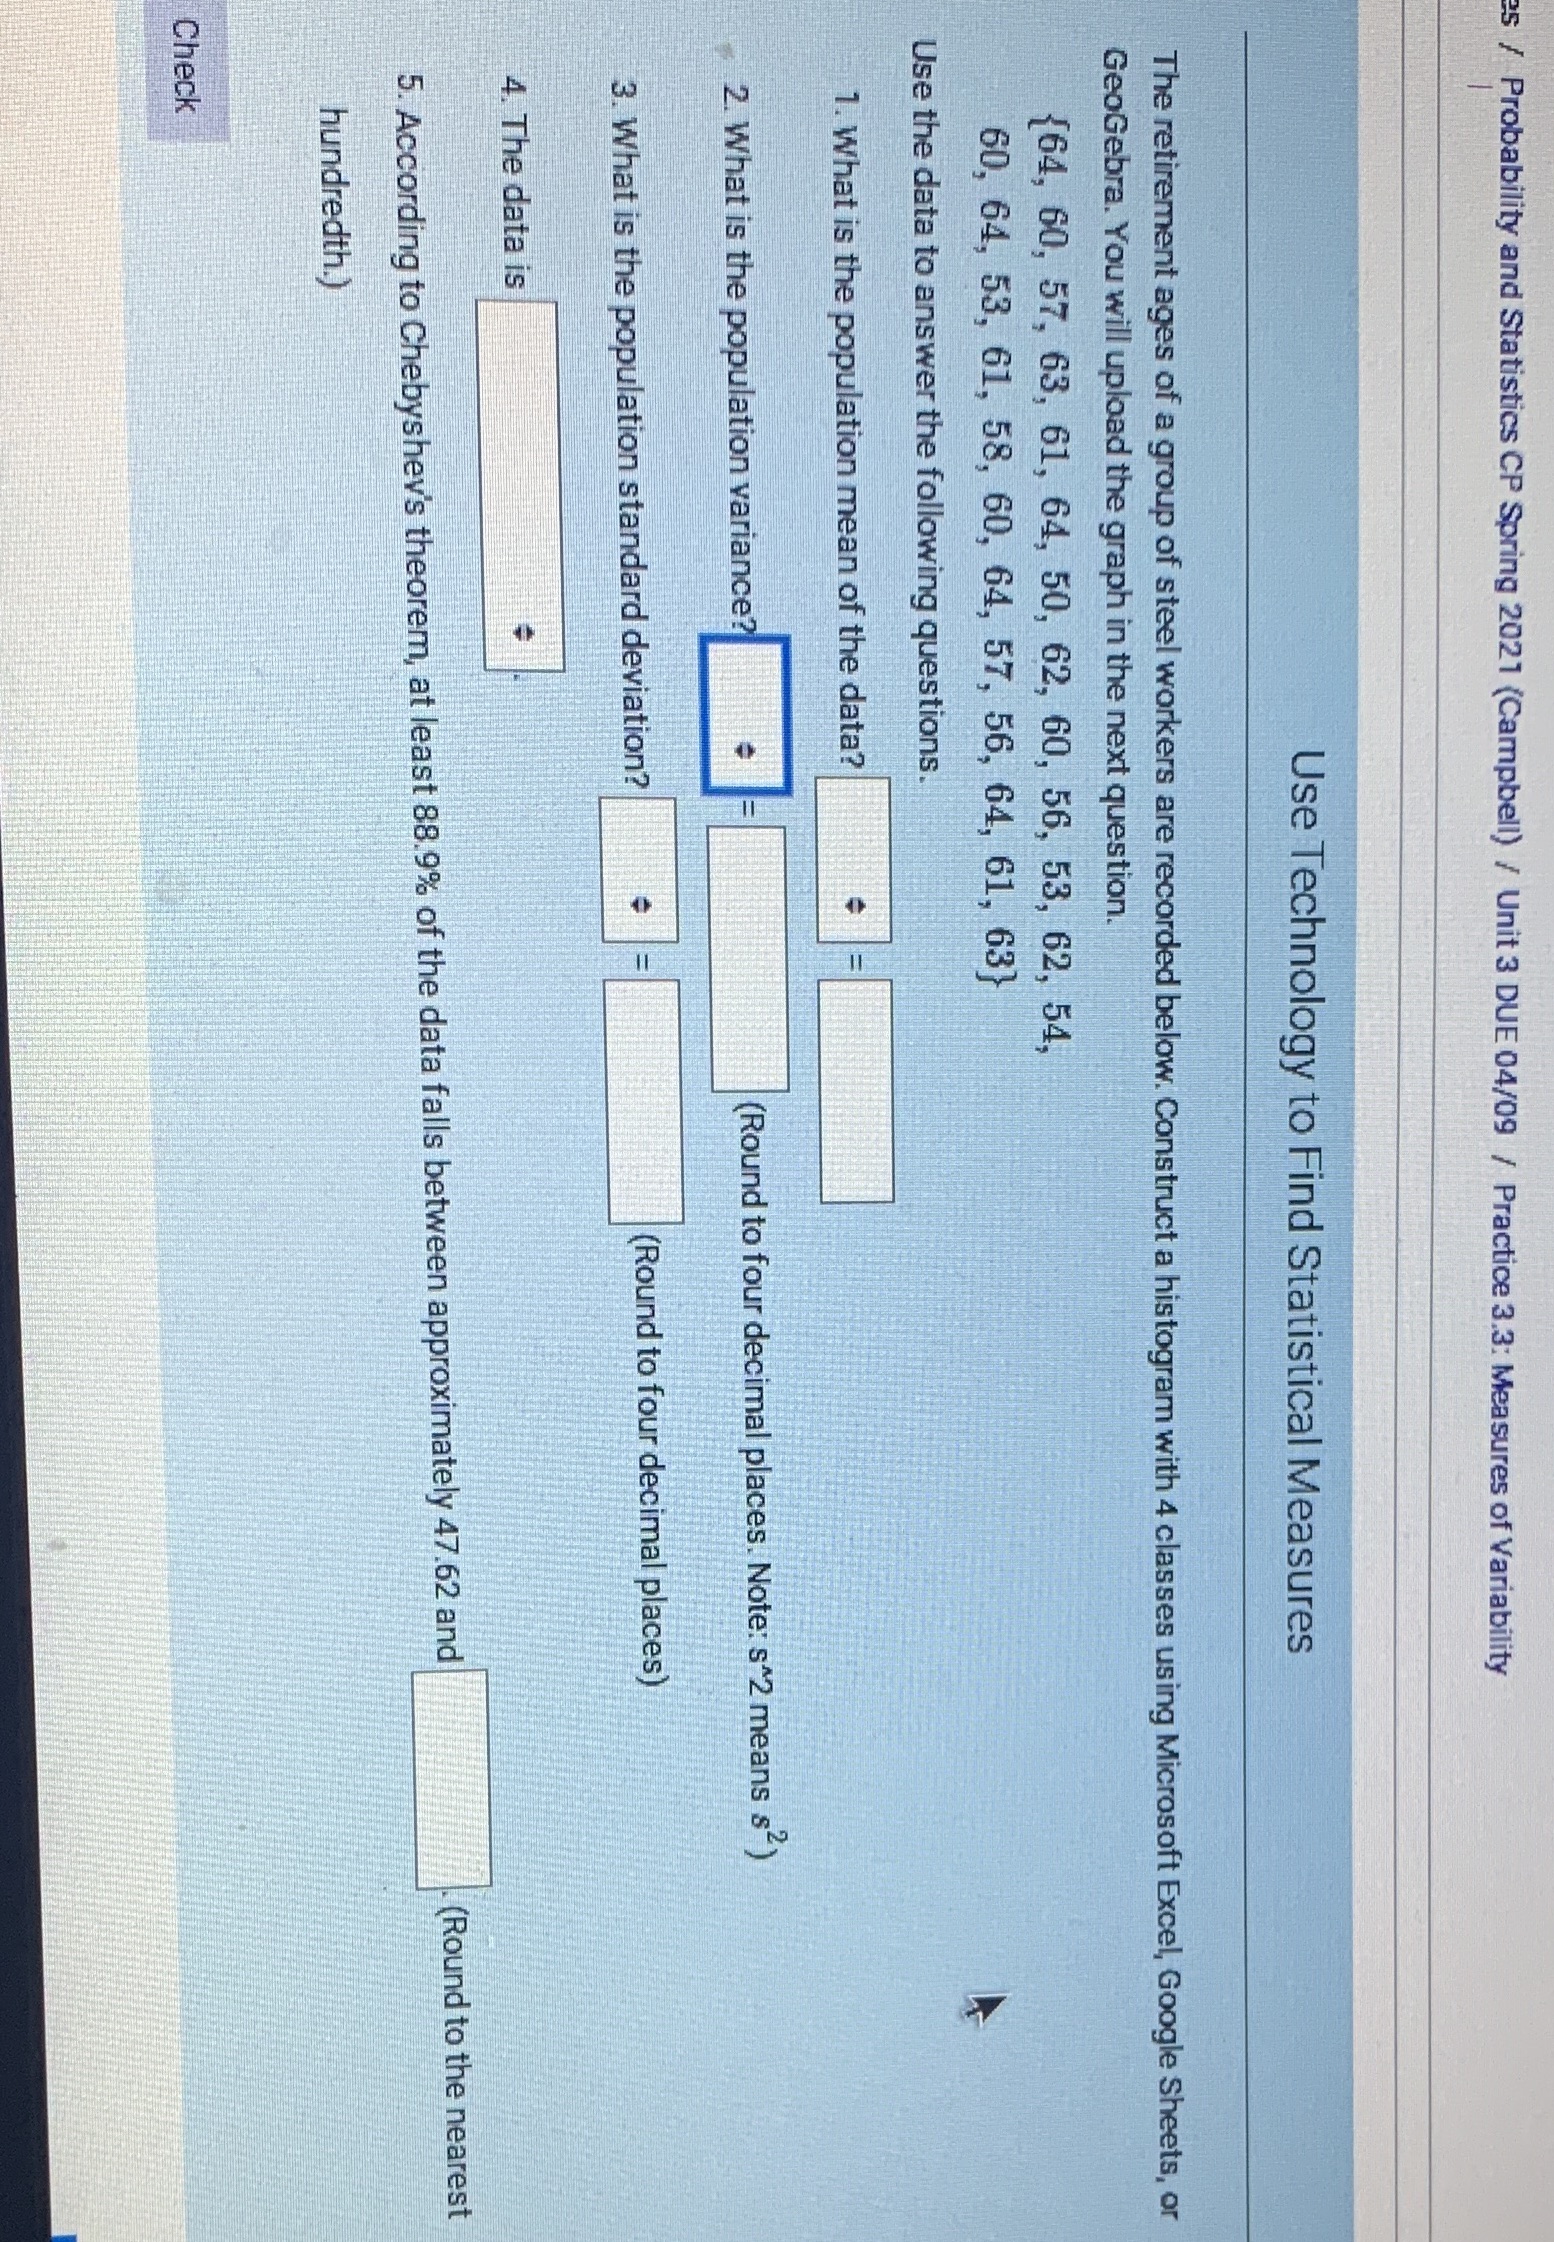
25 / Probability and Statistics CP Spring 2021 (Campbell) / Unit 3 DUE 04/09 / Practice 3.3: Measures of Variability Use Technology to Find Statistical Measures The retirement ages of a group of steel workers are recorded below. Construct a histogram with 4 classes using Microsoft Excel, Google Sheets, or GeoGebra. You will upload the graph in the next question. (64, 60, 57, 63, 61, 64, 50, 62, 60, 56, 53, 62, 54, 60, 64, 53, 61, 58, 60, 64, 57, 56, 64, 61, 63} Use the data to answer the following questions. 1. What is the population mean of the data? 2. What is the population variance? (Round to four decimal places. Note: s*2 means $2) 3. What is the population standard deviation? (Round to four decimal places) 4. The data is 5. According to Chebyshev's theorem, at least 88.9% of the data falls between approximately 47.62 and (Round to the nearest hundredth.) Check
Step by Step Solution
There are 3 Steps involved in it

Get step-by-step solutions from verified subject matter experts