

Question: 1. Appropriate Scatter Diagram based on table below. 1.1 Analysis and recommendations based on scatter plot diagram. 2.Appropriate Control chart based on table below. 2.2
1. Appropriate Scatter Diagram based on table below. 1.1 Analysis and recommendations based on scatter plot diagram. 2.Appropriate Control chart based on table below. 2.2 Analysis and recommendations based on control chart. 3.Appropriate Cause and Effect Diagram based on table below. 3.3 Analysis and recommendations based on cause and effect diagram. 4. Appropriate Force Field Analysis or Affinity Diagram based on table below. 4.4 Analysis and recommendations based on Force Field Analysis or Affinity Diagram
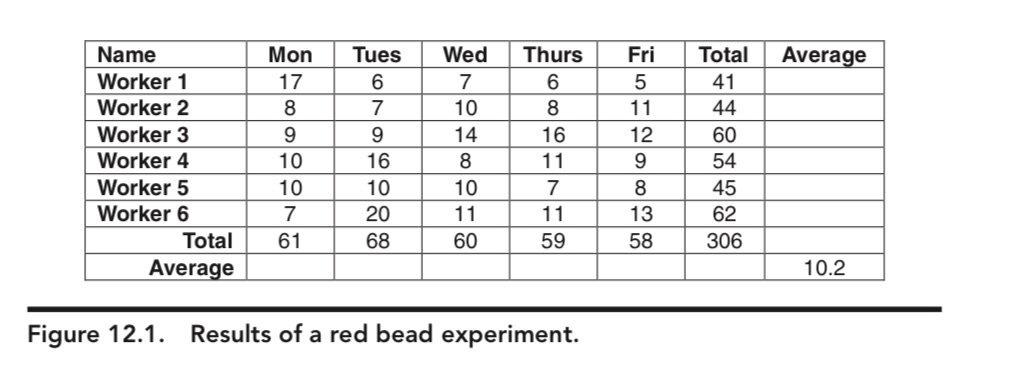
Name Mon Tues Wed Thurs Fri Total Average Worker 1 17 6 7 6 5 41 Worker 2 8 7 10 8 11 44 Worker 3 9 9 14 16 12 60 Worker 4 10 16 8 11 9 54 Worker 5 10 10 10 7 8 45 Worker 6 7 20 11 11 13 62 Total 61 68 60 59 58 306 Average 10.2 Figure 12.1. Results of a red bead experiment
Step by Step Solution
There are 3 Steps involved in it

Get step-by-step solutions from verified subject matter experts