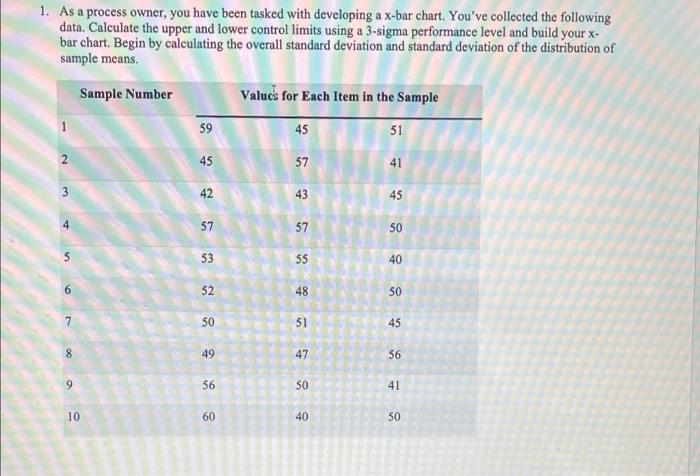
Question: 1. As a process owner, you have been tasked with developing a x-bar chart, You've collected the following data. Calculate the upper and lower control

1. As a process owner, you have been tasked with
1. As a process owner, you have been tasked with developing a x-bar chart, You've collected the following data. Calculate the upper and lower control limits using a 3-sigma performance level and build your X- bar chart. Begin by calculating the overall standard deviation and standard deviation of the distribution of sample means. Sample Number Values for Each Item in the Sample 59 45 51 2 45 57 41 3 42 43 45 4 57 57 50 $ 53 55 40 52 48 50 7 50 51 45 49 47 56 9 56 50 41 10 60 40 50

Step by Step Solution

There are 3 Steps involved in it

1 Expert Approved Answer
Step: 1 Unlock blur-text-image
Question Has Been Solved by an Expert!

Get step-by-step solutions from verified subject matter experts

Step: 2 Unlock
Step: 3 Unlock

Students Have Also Explored These Related General Management Questions!