

Question: 1. As you may recall, the Interstitial Cystitis Data Base (ICDB) Study involved collecting data on patients with interstitial cystitis. Because it is unknown what
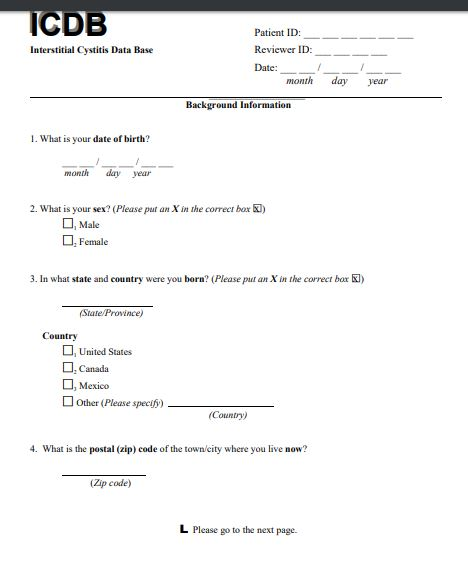
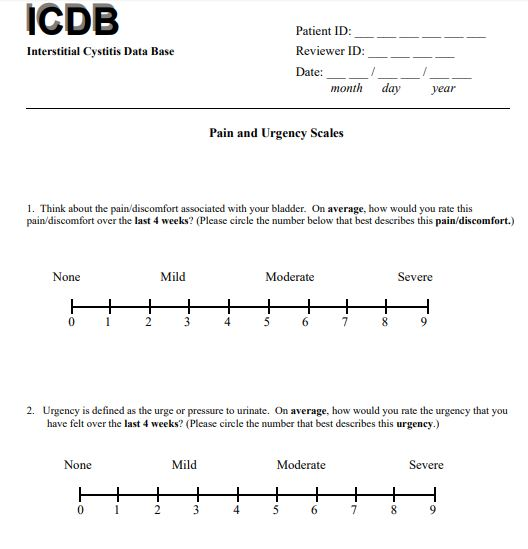
1. As you may recall, the Interstitial Cystitis Data Base (ICDB) Study involved collecting data on patients with interstitial cystitis. Because it is unknown what causes interstitial cystitis, the primary hope was to identify similarities among patients with the disease. The Background Information Form purg.v1.pdf
 and Pain and Urgency Form
 were just two of the data forms completed on the 638 subjects enrolled in the study. The analysis SAS data set (right-click to save!) contains just four of the variables arising from these data forms:
subj, a six-digit subject ID number
sex, the subject's gender (1 = Male, 2 = Female)
income, the subject's household income (1 = less than $30,000, and 2 = at least $30,000)
purg_1, the subject's reported pain score on a scale of 0 (mild) to 9 (severe)
Your job is to use the analysis data set and the REPORT procedure to create a report that looks as close to this as possible:
As you can see, you'll need to use the FORMAT procedure to create user-defined formats for the sex and income variables.
2. The national parks raw data file contains the following information on 11 national parks (or monuments):
ParkName, columns 1-21 contain the park name
Type, the type of the park (NM = national monument, NP = national park)
Region, region of the U.S. (the choices are East or West)
Museums, the number of museums in the park (including visitor centers)
Camping, the number of campgrounds in the park
Your job is to download the data file, read it into a temporary SAS data set called parks, and then use the REPORT procedure to create a report that looks like this:
Three hopefully helpful hints:
You'll need to use Musesums and Camping to compute the Facilities column.
Re-read the last paragraph in the section on group variables. The paragraph is telling you that you'll need to define Region as a group variable to get SAS to properly collapse the report.
Recall that, by default, column widths are 9 for unformatted numeric variables, causing a problem with centering. The Museums and Camping variables should therefore be formatted to 2.0 so that they can be properly centered under the headings.
Here are the two forms:
Step by Step Solution
There are 3 Steps involved in it

Get step-by-step solutions from verified subject matter experts