

Question: 1. Assume a coal power plant is causing an increased amount of pollution because there is a change in the amount of carbon in the
1.
Assume a coal power plant is causing an increased amount of pollution because there is a change in the amount of carbon in the coal. If the pollution causes a negative social externality that has no effect on private costs and benefits, in which of the following ways does the socially efficient equilibrium compare to the free market equilibrium? (1 point)
Optimal social quantity will equal private quantity, and social price will equal private price.
Optimal social quantity will be less than the private unregulated quantity, and social price will be less than private price.
Optimal social quantity will be less than the private unregulated quantity, and the optimal social price will be greater than the private price.
Optimal social quantity will be greater than the private unregulated quantity, and social price will be less than private price.
Optimal social quantity will be greater than the private unregulated quantity, and social price will be greater than private price.
2.
If marginal product increased from 50 to 60 when the quantity of labor increased from 200 to 205, then what must be true of costs over this range of output? (1 point)
Marginal costs are decreasing.
Marginal costs are increasing.
Average total costs are increasing.
Average fixed costs are increasing.
Average variable costs are decreasing.
3.
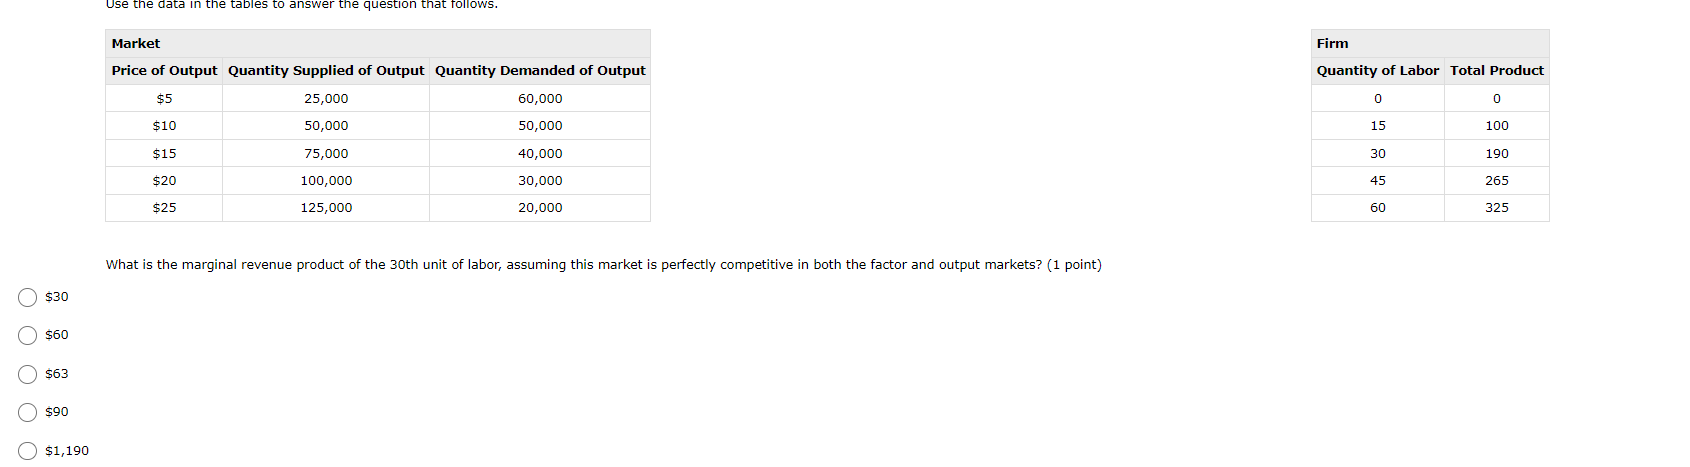
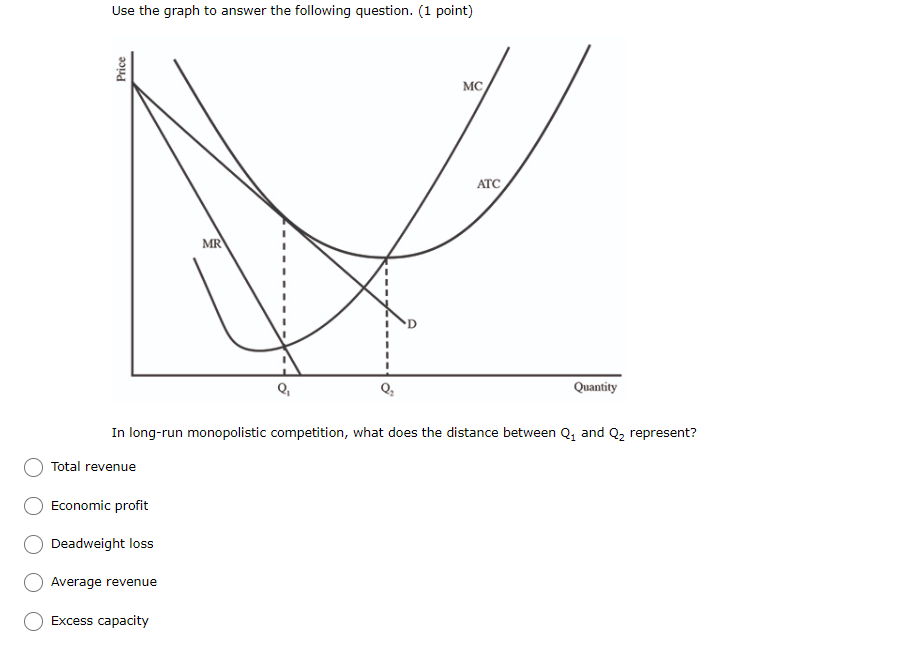
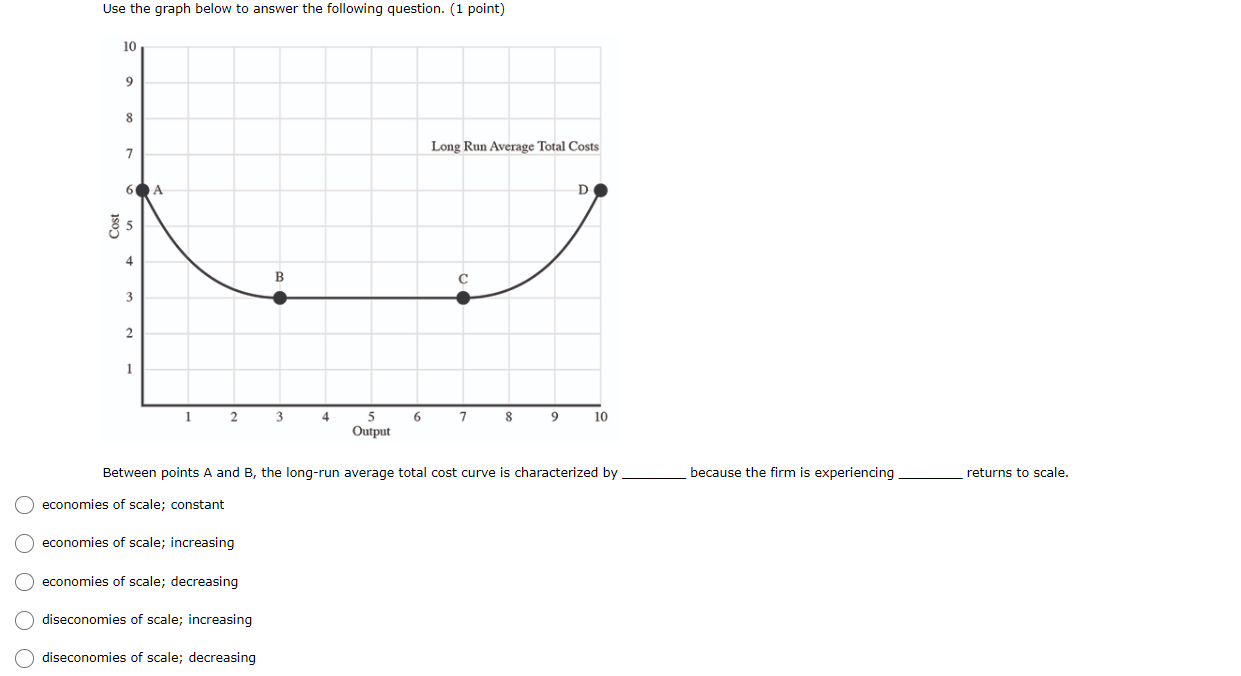
WS. Market Firm Price of Output Quantity Supplied of Output Quantity Demanded of Output Quantity of Labor Total Product $5 25,000 60,000 0 $10 50,000 50,000 15 100 $15 75,000 40,000 30 190 $20 100,000 30,000 45 265 $25 125,000 20,000 60 325 What is the marginal revenue product of the 30th unit of labor, assuming this market is perfectly competitive in both the factor and output markets? (1 point) O $30 $60 O $63 $90 $1,190\fUse the graph to answer the following question. (1 point) Q. 0, Quantity In long-run monopolistic competition, what does the distance between Q1 and Q2 represent? 0 Total revenue 0 Economic prot 0 Deadweight loss 0 average revenue 0 Excess capacity @0000 Use the graph below to answer the following question. [1 point) 10 9 8 1 1m Ram Average Total Com 6 A D l 2 3 4 5 6 '3' B 9 I0 Between points A and B, the longrun average total cost curve is characterized by economies of scale; constant economies of scale; increasing economies of scale; decreasing diseconomies of scale; increasing diseconomies of scale; decreasing because the rm is experiencing returns to scale
Step by Step Solution
There are 3 Steps involved in it

Get step-by-step solutions from verified subject matter experts