

Question: 1. Ball shear strength is an important quality parameter in the IC wire bonding process. For a specific bonding process, the bonding temperature had been
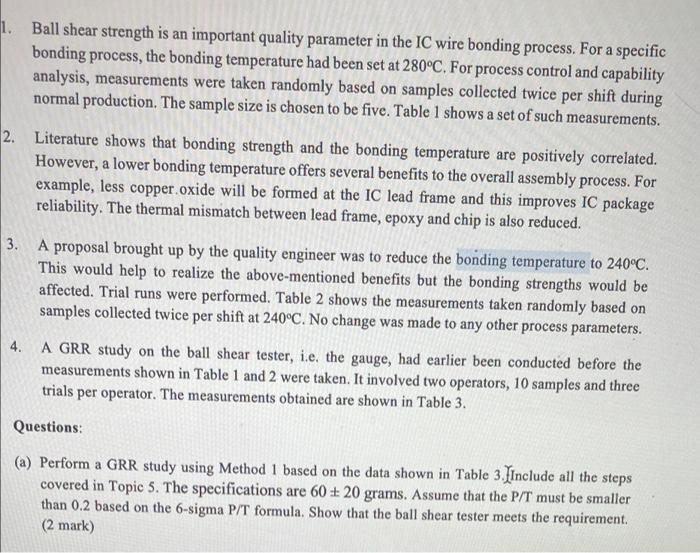
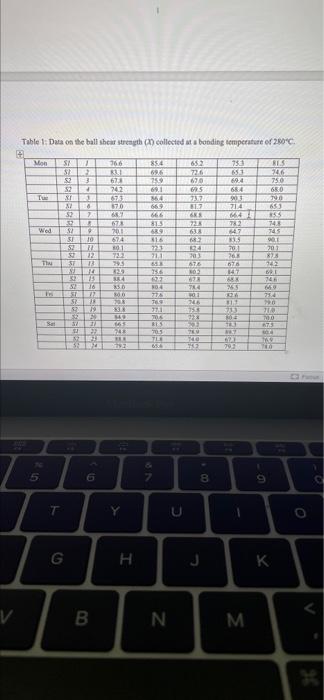
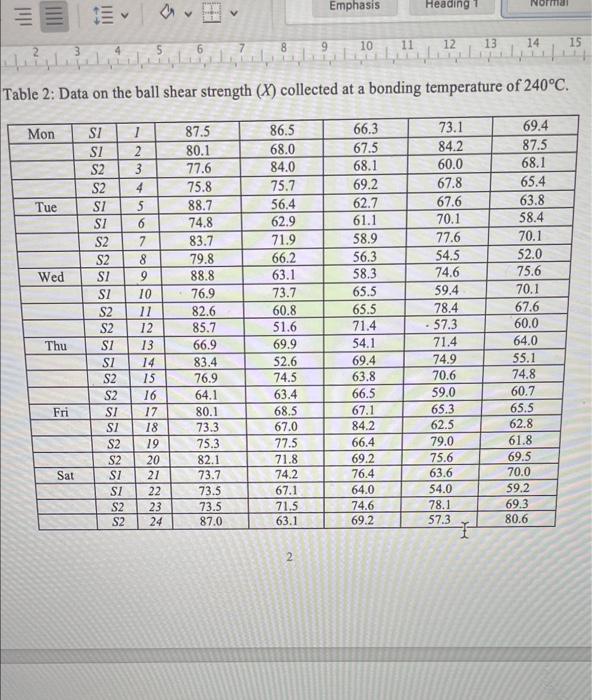
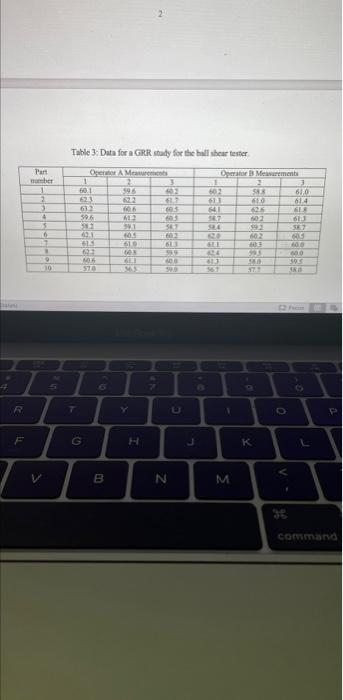
1. Ball shear strength is an important quality parameter in the IC wire bonding process. For a specific bonding process, the bonding temperature had been set at 280C. For process control and capability analysis, measurements were taken randomly based on samples collected twice per shift during normal production. The sample size is chosen to be five. Table 1 shows a set of such measurements. 2. Literature shows that bonding strength and the bonding temperature are positively correlated. However, a lower bonding temperature offers several benefits to the overall assembly process. For example, less copper.oxide will be formed at the IC lead frame and this improves IC package reliability. The thermal mismatch between lead frame, epoxy and chip is also reduced. 3. A proposal brought up by the quality engineer was to reduce the bonding temperature to 240C. This would help to realize the above-mentioned benefits but the bonding strengths would be affected. Trial runs were performed. Table 2 shows the measurements taken randomly based on samples collected twice per shift at 240C. No change was made to any other process parameters. 4. A GRR study on the ball shear tester, i.e. the gauge, had earlier been conducted before the measurements shown in Table 1 and 2 were taken. It involved two operators, 10 samples and three trials per operator. The measurements obtained are shown in Table 3. Questions: a (a) Perform a GRR study using Method 1 based on the data shown in Table 3. Include all the steps covered in Topic 5. The specifications are 60+ 20 grams. Assume that the P/T must be smaller than 0.2 based on the 6-sigma P/T formula. Show that the ball shear tester meets the requirement. (2 mark) Table 1: Data on the ball shear strength collected at a bonding temperature of 200C M SA 1 SIN 52 52 ST 766 RU 671 242 85.4 696 25 69.1 114 652 726 670 GRS P 750 655 69.4 624 00 714 4 2782 47 46 7550 680 90 653 mi 570 8 2 52 699 299 . 11.7 65 723 813 Wed Sa 30 S2 9 10 $16 SPE 105 173 201 674 001 723 29.5 21 Thu 22 13 20 675 701 203 676 147 3 20 823 142 021 74 75 CON VE is 216 ON 33 TE 07 2 2 00 VOX BE 74 TES 20 B MEX 12 YOL Sal 75 E 1 TEL 7.5 23 665 23 23 703 TLE STEV No TA 79 793 5 7 8 o T U G H . J K A B N. M . Emphasis Heading V 8 9 10 11 12 13 14 15 El Table 2: Data on the ball shear strength (X) collected at a bonding temperature of 240C. Mon 1 2 3 NE Tue 5 SI SI S2 S2 Si SI S2 S2 SI SI S2 S2 S1 SI S2 S2 SI SI Noolale Wed 87.5 80.1 77.6 75.8 88.7 74.8 83.7 79.8 88.8 76.9 82.6 85.7 66.9 83.4 76.9 64.1 80.1 73.3 75.3 82.1 73.7 73.5 73.5 87.0 7 8 9 10 11 12 13 14 15 16 17 18 19 20 21 22 23 24 86.5 68.0 84.0 75.7 56.4 62.9 71.9 66.2 63.1 73.7 60.8 51.6 69.9 52.6 74.5 63.4 68.5 67.0 77.5 71.8 74.2 67.1 71.5 63.1 66.3 67.5 68.1 69.2 62.7 61.1 58.9 56.3 58.3 65.5 65.5 71.4 54.1 69.4 63.8 66.5 67.1 84.2 66.4 69.2 76.4 64.0 74.6 69.2 73.1 84.2 60.0 67.8 67.6 70.1 77.6 54.5 74.6 59.4 78.4 57.3 71.4 74.9 70.6 59.0 65.3 62.5 79.0 75.6 63.6 54.0 78.1 57.3 I 69.4 87.5 68.1 65.4 63.8 58.4 70.1 52.0 75.6 70.1 67.6 60.0 64.0 55.1 74.8 60.7 65.5 62.8 61.8 69.5 70.0 59.2 69.3 80.6 Thu Fri S2 Sat SISI S2 Si SI S2 S2 2 Table 3: Data for a GRR study for the hallshear tester Part ber 1 2 3 $ 05 6 Operater A Mer 1 2 601 521 606 596 2 S1 GOS 603 567 Operate Measurement 1 603 53 610 610 614 541 25 SI 527 503 326 993 SE? 10 005 SI 08 61 611 M 590 613 39 10 6 R Y C O G H H K B N M command 1. Ball shear strength is an important quality parameter in the IC wire bonding process. For a specific bonding process, the bonding temperature had been set at 280C. For process control and capability analysis, measurements were taken randomly based on samples collected twice per shift during normal production. The sample size is chosen to be five. Table 1 shows a set of such measurements. 2. Literature shows that bonding strength and the bonding temperature are positively correlated. However, a lower bonding temperature offers several benefits to the overall assembly process. For example, less copper.oxide will be formed at the IC lead frame and this improves IC package reliability. The thermal mismatch between lead frame, epoxy and chip is also reduced. 3. A proposal brought up by the quality engineer was to reduce the bonding temperature to 240C. This would help to realize the above-mentioned benefits but the bonding strengths would be affected. Trial runs were performed. Table 2 shows the measurements taken randomly based on samples collected twice per shift at 240C. No change was made to any other process parameters. 4. A GRR study on the ball shear tester, i.e. the gauge, had earlier been conducted before the measurements shown in Table 1 and 2 were taken. It involved two operators, 10 samples and three trials per operator. The measurements obtained are shown in Table 3. Questions: a (a) Perform a GRR study using Method 1 based on the data shown in Table 3. Include all the steps covered in Topic 5. The specifications are 60+ 20 grams. Assume that the P/T must be smaller than 0.2 based on the 6-sigma P/T formula. Show that the ball shear tester meets the requirement. (2 mark) Table 1: Data on the ball shear strength collected at a bonding temperature of 200C M SA 1 SIN 52 52 ST 766 RU 671 242 85.4 696 25 69.1 114 652 726 670 GRS P 750 655 69.4 624 00 714 4 2782 47 46 7550 680 90 653 mi 570 8 2 52 699 299 . 11.7 65 723 813 Wed Sa 30 S2 9 10 $16 SPE 105 173 201 674 001 723 29.5 21 Thu 22 13 20 675 701 203 676 147 3 20 823 142 021 74 75 CON VE is 216 ON 33 TE 07 2 2 00 VOX BE 74 TES 20 B MEX 12 YOL Sal 75 E 1 TEL 7.5 23 665 23 23 703 TLE STEV No TA 79 793 5 7 8 o T U G H . J K A B N. M . Emphasis Heading V 8 9 10 11 12 13 14 15 El Table 2: Data on the ball shear strength (X) collected at a bonding temperature of 240C. Mon 1 2 3 NE Tue 5 SI SI S2 S2 Si SI S2 S2 SI SI S2 S2 S1 SI S2 S2 SI SI Noolale Wed 87.5 80.1 77.6 75.8 88.7 74.8 83.7 79.8 88.8 76.9 82.6 85.7 66.9 83.4 76.9 64.1 80.1 73.3 75.3 82.1 73.7 73.5 73.5 87.0 7 8 9 10 11 12 13 14 15 16 17 18 19 20 21 22 23 24 86.5 68.0 84.0 75.7 56.4 62.9 71.9 66.2 63.1 73.7 60.8 51.6 69.9 52.6 74.5 63.4 68.5 67.0 77.5 71.8 74.2 67.1 71.5 63.1 66.3 67.5 68.1 69.2 62.7 61.1 58.9 56.3 58.3 65.5 65.5 71.4 54.1 69.4 63.8 66.5 67.1 84.2 66.4 69.2 76.4 64.0 74.6 69.2 73.1 84.2 60.0 67.8 67.6 70.1 77.6 54.5 74.6 59.4 78.4 57.3 71.4 74.9 70.6 59.0 65.3 62.5 79.0 75.6 63.6 54.0 78.1 57.3 I 69.4 87.5 68.1 65.4 63.8 58.4 70.1 52.0 75.6 70.1 67.6 60.0 64.0 55.1 74.8 60.7 65.5 62.8 61.8 69.5 70.0 59.2 69.3 80.6 Thu Fri S2 Sat SISI S2 Si SI S2 S2 2 Table 3: Data for a GRR study for the hallshear tester Part ber 1 2 3 $ 05 6 Operater A Mer 1 2 601 521 606 596 2 S1 GOS 603 567 Operate Measurement 1 603 53 610 610 614 541 25 SI 527 503 326 993 SE? 10 005 SI 08 61 611 M 590 613 39 10 6 R Y C O G H H K B N M command
Step by Step Solution
There are 3 Steps involved in it

Get step-by-step solutions from verified subject matter experts