

Question: 1. Based on financial reports prepare ratio analysis and interpret the result of the following ratios: Liquidity: Current Ratio, Quick Ratio Leverage: Debt to Total
1. Based on financial reports prepare ratio analysis and interpret the result of the following ratios:
- Liquidity: Current Ratio, Quick Ratio
- Leverage: Debt to Total Assets Ratio, Debt to Equity Ratio
- Profitability: Based on Sales, Based on Investment, and based on Market Ratios
----------------------------------
-------------------------------------------------------
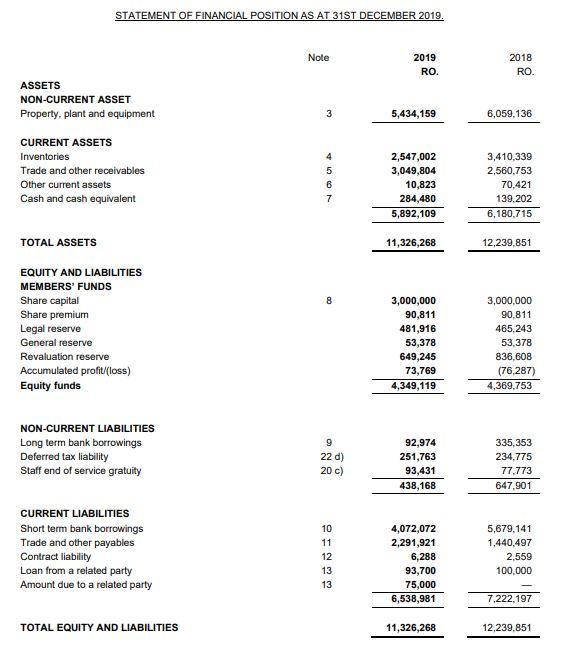
STATEMENT OF FINANCIAL POSITION AS AT 31ST DECEMBER 2019. Note 2019 RO. 5,434,159 2,547,002 3,049,804 10,823 284,480 5,892,109 11,326,268 3,000,000 90,811 481,916 53,378 649,245 73,769 4,349,119 92,974 251,763 93,431 438,168 4,072,072 2,291,921 6,288 93,700 75,000 6,538,981 11,326,268 ASSETS NON-CURRENT ASSET Property, plant and equipment CURRENT ASSETS Inventories Trade and other receivables Other current assets Cash and cash equivalent TOTAL ASSETS EQUITY AND LIABILITIES MEMBERS' FUNDS Share capital Share premium Legal reserve General reserve Revaluation reserve Accumulated profit/(loss) Equity funds NON-CURRENT LIABILITIES Long term bank borrowings Deferred tax liability Staff end of service gratuity CURRENT LIABILITIES Short term bank borrowings Trade and other payables Contract liability Loan from a related party Amount due to a related party TOTAL EQUITY AND LIABILITIES 3 4567 8 9 22 d) 20 c) 10 11 12 13 13 2018 RO. 6,059,136 3,410,339 2,560,753 70,421 139.202 6,180,715 12,239,851 3,000,000 90,811 465,243 53,378 836,608 (76,287) 4,369,753 335,353 234,775 77,773 647,901 5,679,141 1,440,497 2,559 100,000 7,222,197 12,239,851
Step by Step Solution
3.32 Rating (161 Votes )
There are 3 Steps involved in it
LIQUIDITY RATIOS Current Ratio Current assets current liabilities 2019 2018 58921096538981 6180715 7222197 091 0861 The liquidity position shows the f... View full answer

Get step-by-step solutions from verified subject matter experts