

Question: 1. Based on the data in Table 16.1, create totals for each funding source while still showing the departments associated with each funding source. (Hint:
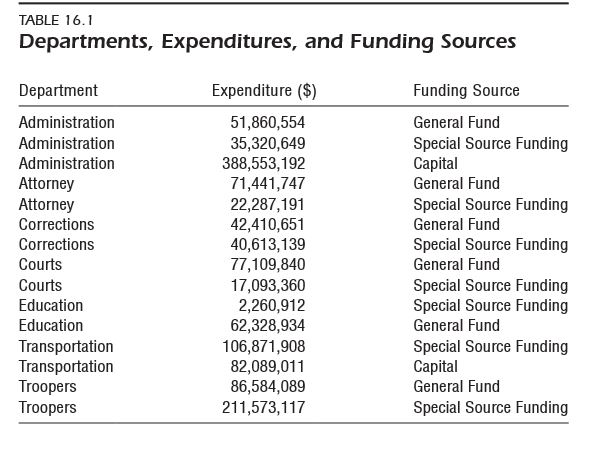 1. Based on the data in Table 16.1, create totals for each funding source while still showing the departments associated with each funding source. (Hint: Subtotals and/or pivot tables are good tools to help you accomplish this in Excel.)
TABLE 16.1 Departments, Expenditures, and Funding Sources Department Expenditure ($) Funding Source Administration Administration Administration Attorney Attorney Corrections Corrections Courts Courts Education Education Transportation Transportation Troopers Troopers 51,860,554 35,320,649 388,553,192 71,441,747 22,287,191 42,410,651 40,613,139 77,109,840 17,093,360 2,260,912 62,328,934 106,871,908 82,089,011 86,584,089 211,573,117 General Fund Special Source Funding Capital General Fund Special Source Funding General Fund Special Source Funding General Fund Special Source Funding Special Source Funding General Fund Special Source Funding Capital General Fund Special Source Funding
Step by Step Solution
There are 3 Steps involved in it

Get step-by-step solutions from verified subject matter experts