

Question: 1. Based on the working capital understanding, analyze and evaluate the J&Js liquidity and activity performance over time and relative to its competitor (Pfizer) and
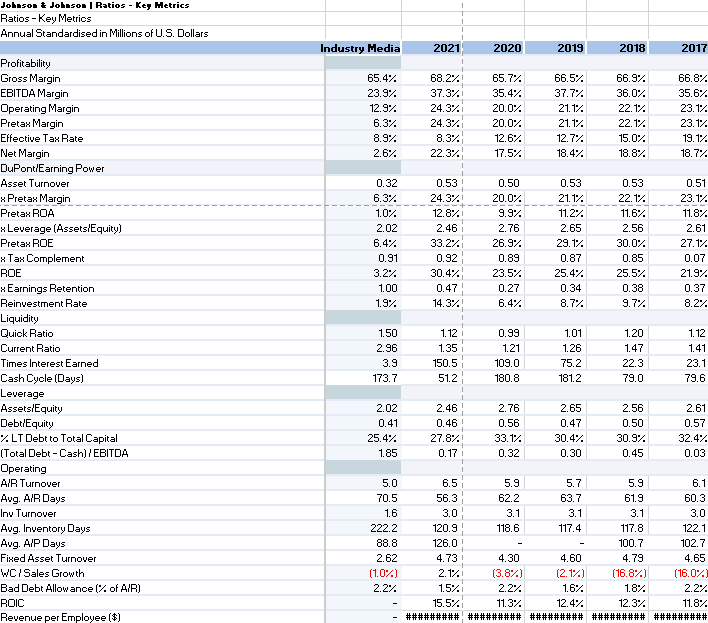
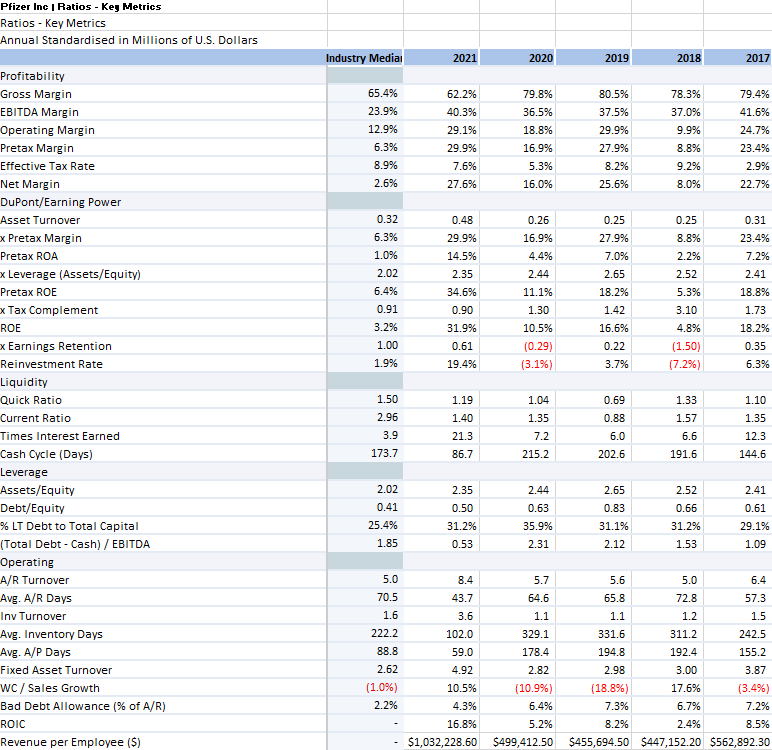 1. Based on the working capital understanding, analyze and evaluate the J&Js liquidity and activity performance over time and relative to its competitor (Pfizer) and industry, using financial statement ratios as major analytical tools.
2. Based on the leverage and capital structure understanding, analyze and evaluate the J&Js risk over time and relative to its competitor (Pfizer) and industry, using financial statement ratios as major analytical tools.
Johnson & Johnson | Ratios - Key Hetrics Ratios - Key Metrics Annual Standardised in Millions of U.S. Dollars Industry Media 2021 2020 2019 2018 2017 65.4% 23.9%. 12.9% 6.3%. 8.9%. 2.6% 68.2% 37.3%. 24.3% 24.3% 8.37. 22.3% 65.7% 35.4% 20.0% 20.0% 12.6% 17.5%. 66.5%. 37.7%. 21.17 21.17 12.7% 18.4% 66.9% 36.0% 22.17 22.1% 15.0% 18.87 66.8% 35.6%. 23.1% 23.1% 19.1% 18.7% -- 0.32 6.3% 1.0% 2.02 6.4% 0.91 3.2% 1.00 1.9% 0.53 24.3% 12.8% 2.46 33.2% 0.92 30.4% 0.47 14.3%. 0.50 20.0% 9.9% 2.76 26.9% 0.89 23.5% 0.27 6.4% 0.53 21.1% 11.2% 2.65 29.1% 0.87 25.4%. 0.34 8.7% 0.53 22.1% 11.6% 2.56 30.07 0.85 25.5% 0.38 9.7%. 0.51 23.17 11.8% 2.61 27.1% 0.07 21.9% 0.37 8.2% Profitability Gross Margin EBITDA Margin Operating Margin Pretax Margin Effective Tax Rate Net Margin DuPont/Earning Power Asset Turnover Pretax Margin Pretax ROA Leverage (Assets/Equity) Pretax ROE x Tax Complement ROE xEarnings Retention Reinvestment Rate Liquidity Quick Ratio Current Ratio Times Interest Earned Cash Cycle (Days) Leverage Assets/Equity Debt/Equity LT Debt to Total Capital (Total Debt-Cash) / EBITDA Operating AIR Turnover Avg. AIR Days Inv Turnover Avg. Inventory Days Avg. AIP Days Fixed Asset Turnover WC/Sales Growth Bad Debt Allowance 1% of AIR) ROIC Revenue per Employee ($) 1.50 2.96 3.9 173.7 1.12 1.35 150.5 512 0.99 1.21 109.0 180.8 1.01 1.26 75.2 181.2 1.20 1.47 22.3 79.0 1.12 1.41 23.1 79.6 2.02 0.41 25.4%. 1.85 2.46 0.46 27.8% 0.17 2.76 0.56 33.1% 0.32 2.65 0.47 30.4% 0.30 2.56 0.50 30.9% 0.45 2.61 0.57 32.4% 0.03 Owu 5.9 62.2 3.1 118.6 5.7 63.7 3.1 117.4 5.0 70.5 1.6 222.2 88.8 2.62 (1.0%) 2.2% 6.5 56.3 3.0 120.9 126.0 4.73 2.1% 1.5% 15.5% ######### 5.9 61.9 3.1 117.8 100.7 4.79 (16.87) 1.8% 12.374 ###### 6.1 60.3 3.0 122.1 102.7 4.65 (16.07 2.2% 11.8% ######### 4.30 (3.8%) 2.2% 11.37 ##### 4.60 (2.17) 1.6% 12.4% #### Pfizer Inc | Ratios - Key Metrics Ratios - Key Metrics Annual Standardised in Millions of U.S. Dollars Industry Media 2021 2020 2019 2018 2017 78.3% 65.4% 23.9% 12.9% 6.3% 8.9% 2.6% 62.2% 40.3% 29.1% 29.9% 7.6% 27.6% 79.8% 36.5% 18.8% 16.9% 5.3% 16.0% 80.5% 37.5% 29.9% 27.9% 8.2% 25.6% 37.0% 9.9% 8.8% 9.2% 8.0% 79.4% 41.6% 24.7% 23.4% 2.9% 22.7% 0.32 6.3% 0.48 29.9% 0.26 16.9% 4.4% 2.44 11.1% 0.25 27.9% 7.0% 1.0% 2.02 6.4% 0.91 14.5% 2.35 34.6% 0.90 31.9% 0.61 19.4% 0.25 8.8% 2.2% 2.52 5.3% 3.10 4.8% (1.50) (7.2%) 2.65 18.2% 1.42 16.6% 0.22 3.7% 0.31 23.4% 7.2% 2.41 18.8% 1.73 18.2% 0.35 6.3% 1.30 3.2% 1.00 10.5% (0.29) (3.1%) 1.9% 1.50 Profitability Gross Margin EBITDA Margin Operating Margin Pretax Margin Effective Tax Rate Net Margin DuPont/Earning Power Asset Turnover x Pretax Margin Pretax ROA x Leverage (Assets/Equity) Pretax ROE x Tax Complement ROE * Earnings Retention Reinvestment Rate Liquidity Quick Ratio Current Ratio Times Interest Earned Cash Cycle (Days) Leverage Assets/Equity Debt/Equity % LT Debt to Total Capital (Total Debt - Cash) / EBITDA Operating A/R Turnover Avg. A/R Days Inv Turnover Avg. Inventory Days Avg. A/P Days Fixed Asset Turnover WC/ Sales Growth Bad Debt Allowance % of A/R) ROIC Revenue per Employee ($) 1.10 1.35 2.96 1.19 1.40 21.3 86.7 1.04 1.35 7.2 0.69 0.88 6.0 202.6 1.33 1.57 6.6 191.6 3.9 173.7 0 0 12.3 144.6 215.2 2.02 2.44 2.52 2.35 0.50 2.65 0.83 0.66 0.41 25.4% 1.85 2.41 0.61 29.1% 1.09 0.63 35.9% 2.31 31.2% 0.53 31.1% 2.12 31.2% 1.53 5.0 70.5 1.6 1.1 222.2 88.8 2.62 8.4 5.7 43.7 64.6 3.6 1.1 102.0 329.1 59.0 178.4 4.92 2.82 10.5% (10.9%) 4.3% 6.4% 16.8% 5.2% $1,032,228.60 $499,412.50 5.6 5.0 6.4 65.8 72.8 57.3 1.2 1.5 331.6 311.2 242.5 194.8 192.4 155.2 2.98 3.00 3.87 (18.8%) 17.6% (3.4%) 7.3% 6.7% 7.2% 8.2% 2.4% 8.5% $455,694.50 $447,152.20 $562,892.30 (1.0%) 2.2%
Step by Step Solution
There are 3 Steps involved in it

Get step-by-step solutions from verified subject matter experts