

Question: 1. Based on your two different scatter plots (Home Runs versus RBI), which of the two baseball statistics of Ted Williams seems to fit
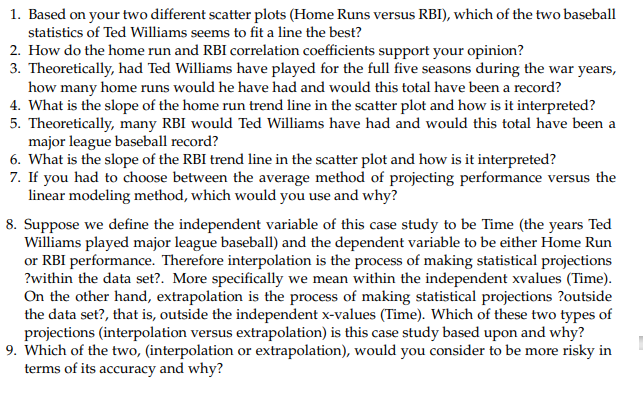
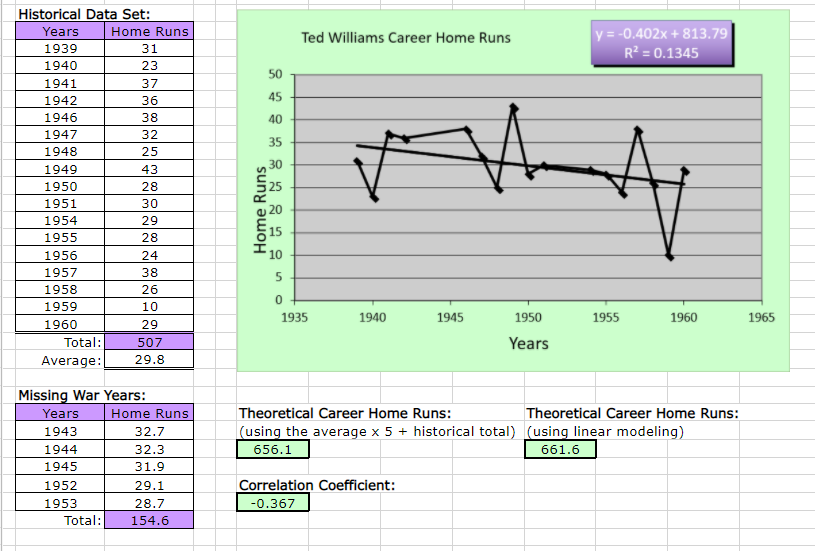
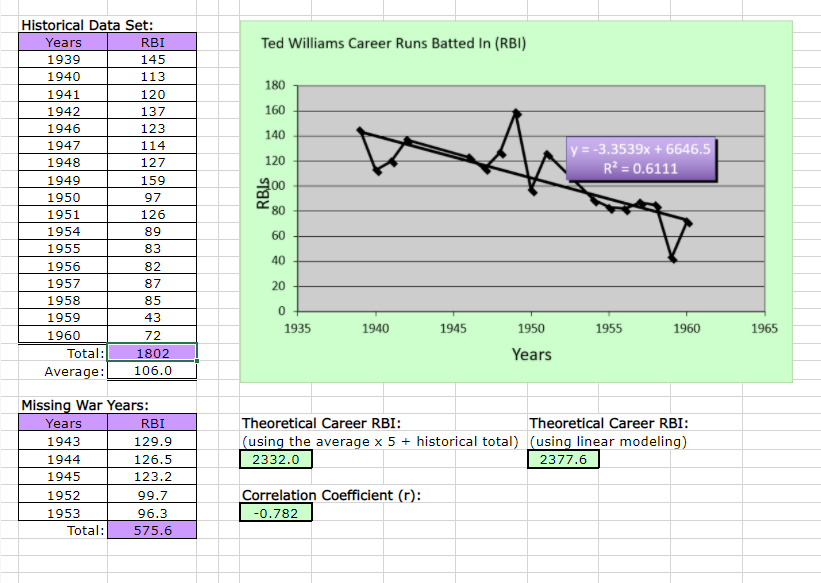
1. Based on your two different scatter plots (Home Runs versus RBI), which of the two baseball statistics of Ted Williams seems to fit a line the best? 2. How do the home run and RBI correlation coefficients support your opinion? 3. Theoretically, had Ted Williams have played for the full five seasons during the war years, how many home runs would he have had and would this total have been a record? 4. What is the slope of the home run trend line in the scatter plot and how is it interpreted? 5. Theoretically, many RBI would Ted Williams have had and would this total have been a major league baseball record? 6. What is the slope of the RBI trend line in the scatter plot and how is it interpreted? 7. If you had to choose between the average method of projecting performance versus the linear modeling method, which would you use and why? 8. Suppose we define the independent variable of this case study to be Time (the years Ted Williams played major league baseball) and the dependent variable to be either Home Run or RBI performance. Therefore interpolation is the process of making statistical projections ?within the data set?. More specifically we mean within the independent xvalues (Time). On the other hand, extrapolation is the process of making statistical projections ?outside the data set?, that is, outside the independent x-values (Time). Which of these two types of projections (interpolation versus extrapolation) is this case study based upon and why? 9. Which of the two, (interpolation or extrapolation), would you consider to be more risky in terms of its accuracy and why? Historical Data Set: Years 1939 1940 1941 1942 1946 1947 1948 1949 1950 1951 1954 1955 1956 1957 1958 1959 1960 Total: Average: Years 1943 1944 1945 1952 1953 Home Runs Total: 31 23 37 36 38 32 25 43 28 30 29 28 Missing War Years: 24 38 26 10 29 507 29.8 Home Runs 32.7 32.3 31.9 29.1 28.7 154.6 Home Runs 50 45 40 35 30 10 5 0 Ted Williams Career Home Runs 1935 1940 1945 Correlation Coefficient: -0.367 1950 Years y = -0.402x+813.79 R = 0.1345 1955 1960 Theoretical Career Home Runs: (using the average x 5 + historical total) (using linear modeling) 656.1 661.6 Theoretical Career Home Runs: 1965 Historical Data Set: Years 1939 1940 1941 1942 1946 1947 1948 1949 1950 1951 1954 1955 1956 1957 1958 1959 1960 RBI 145 113 120 137 123 114 127 159 97 126 89 83 82 72 Total: 1802 Average: 106.0 1952 1953 87 85 43 Missing War Years: Years 1943 1944 1945 Total: RBI 129.9 126.5 123.2 99.7 96.3 575.6 Ted Williams Career Runs Batted In (RBI) 180 160 140 120 00 RBIS 80 60 40 20 0 1935 X A 1940 1945 Correlation Coefficient (r): -0.782 1950 Years y = -3.3539x +6646.5 R = 0.6111 1955 1960 Theoretical Career RBI: Theoretical Career RBI: (using the average x 5 + historical total) (using linear modeling) 2332.0 2377.6 1965
Step by Step Solution
3.41 Rating (154 Votes )
There are 3 Steps involved in it
1 Based on the scatter plots provided the RBI statistics seem to fit the line better This is supported by the correlation coefficient r value and the coefficient of determination R2 value for RBIs whi... View full answer

Get step-by-step solutions from verified subject matter experts