

Question: 1. Below is a table exhibiting pollution data for Big Polluter Manufacturing Company. Using the data, graph and indicate where and how much the government
1. Below is a table exhibiting pollution data for Big Polluter Manufacturing Company. Using the data, graph and indicate where and how much the government will tax emissions so that MSB=MSC. Show the effects of the tax using curves on the graph and any movement of the curves. Be sure to fully label the graph.
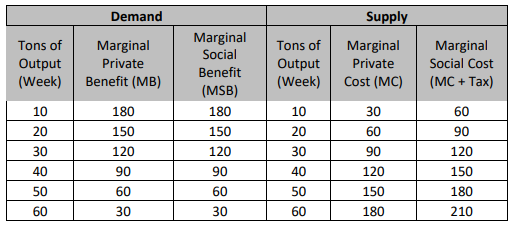
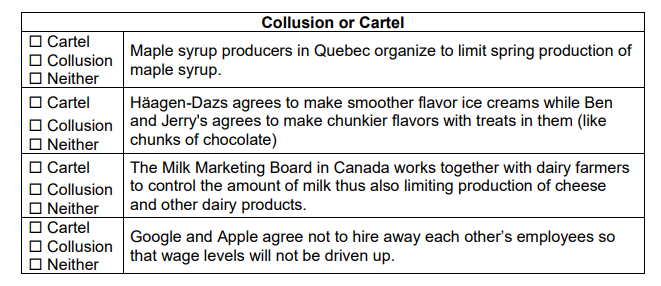
Demand Supply Tons of Marginal Marginal Social Tons of Marginal Marginal Output Private Benefit Output Private Social Cost (Week) Benefit (MB) (MSB) [Week) Cost (MC) (MC + Tax) 10 180 180 10 30 60 20 150 150 20 60 90 30 120 120 30 90 120 40 90 90 40 120 150 50 60 60 50 150 180 60 30 30 60 180 210Collusion or Cartel Cartel Collusion Maple syrup producers in Quebec organize to limit spring production of Neither maple syrup. O Cartel Haagen-Dazs agrees to make smoother flavor ice creams while Ben Collusion and Jerry's agrees to make chunkier flavors with treats in them (like Neither chunks of chocolate) O Cartel The Milk Marketing Board in Canada works together with dairy farmers Collusion to control the amount of milk thus also limiting production of cheese Neither and other dairy products. Cartel O Collusion Google and Apple agree not to hire away each other's employees so Neither that wage levels will not be driven up
Step by Step Solution
There are 3 Steps involved in it

Get step-by-step solutions from verified subject matter experts