

Question: 1. Below is table report provided by the customer? What are the six most important questions to ask your client before conducting a successful report
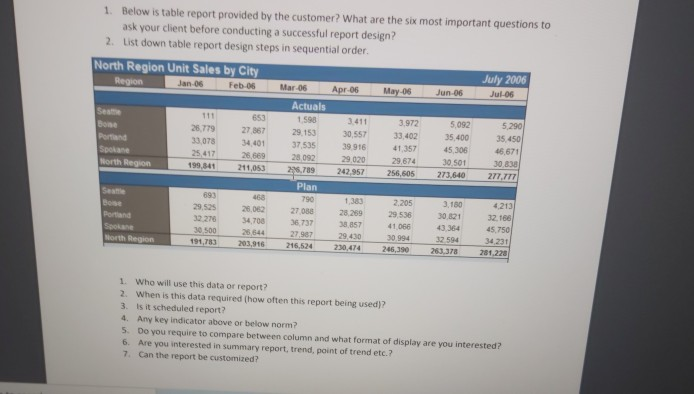
1. Below is table report provided by the customer? What are the six most important questions to ask your client before conducting a successful report design? 2. List down table report design steps in sequential order. North Region Unit Sales by City July 2006 Region Jan 06 Feb 06 Mar-06 Apr-06 May-05 Jun 06 Jul 06 Actuals Seat 111 653 1.598 3.411 3.972 5,092 5,290 26,779 27 367 29.153 30,557 33.402 35,400 35.450 33 078 34,401 37.535 39.916 41.357 45 306 45 671 Spokane 25,417 26,669 28.092 29.020 29,674 30 501 30,838 Horth Region 199.841 211.053 295.789 242.957 256.605 273,640 277.777 Plan 693 468 790 1,383 2,205 3.100 4.213 29.525 26.062 27 088 28 259 29 536 30,821 32.168 Portland 32 276 34 700 36.737 38,857 41 066 43,364 45.750 Spokane 30 500 25,644 27.987 29.430 30 994 32 594 34.231 Morth Region 191,783 203,916 215,524 230,474 246,390 263.378 281.228 1. Who will use this data or report? 2. When is this data required (how often this report being used)? 3. is it scheduled report? 4. Any key indicator above or below norm? 5. Do you require to compare between column and what format of display are you interested? 6. Are you interested in summary report, trend, point of trend etc.? 7. Can the report be customized? 1. Below is table report provided by the customer? What are the six most important questions to ask your client before conducting a successful report design? 2. List down table report design steps in sequential order. North Region Unit Sales by City July 2006 Region Jan 06 Feb 06 Mar-06 Apr-06 May-05 Jun 06 Jul 06 Actuals Seat 111 653 1.598 3.411 3.972 5,092 5,290 26,779 27 367 29.153 30,557 33.402 35,400 35.450 33 078 34,401 37.535 39.916 41.357 45 306 45 671 Spokane 25,417 26,669 28.092 29.020 29,674 30 501 30,838 Horth Region 199.841 211.053 295.789 242.957 256.605 273,640 277.777 Plan 693 468 790 1,383 2,205 3.100 4.213 29.525 26.062 27 088 28 259 29 536 30,821 32.168 Portland 32 276 34 700 36.737 38,857 41 066 43,364 45.750 Spokane 30 500 25,644 27.987 29.430 30 994 32 594 34.231 Morth Region 191,783 203,916 215,524 230,474 246,390 263.378 281.228 1. Who will use this data or report? 2. When is this data required (how often this report being used)? 3. is it scheduled report? 4. Any key indicator above or below norm? 5. Do you require to compare between column and what format of display are you interested? 6. Are you interested in summary report, trend, point of trend etc.? 7. Can the report be customized
Step by Step Solution
There are 3 Steps involved in it

Get step-by-step solutions from verified subject matter experts