

Question: 1. Briefly explain each step in creating the 7 Basic Quality Control Tool - Pareto Analysis - Stratification - Cheek Sheet - Histogram - Scatter
1. Briefly explain each step in creating the 7 Basic Quality Control Tool
- Pareto Analysis
- Stratification
- Cheek Sheet
- Histogram
- Scatter Diagram
- Control Chart
- Cause and Effect Diagram
2. Explain each diagram
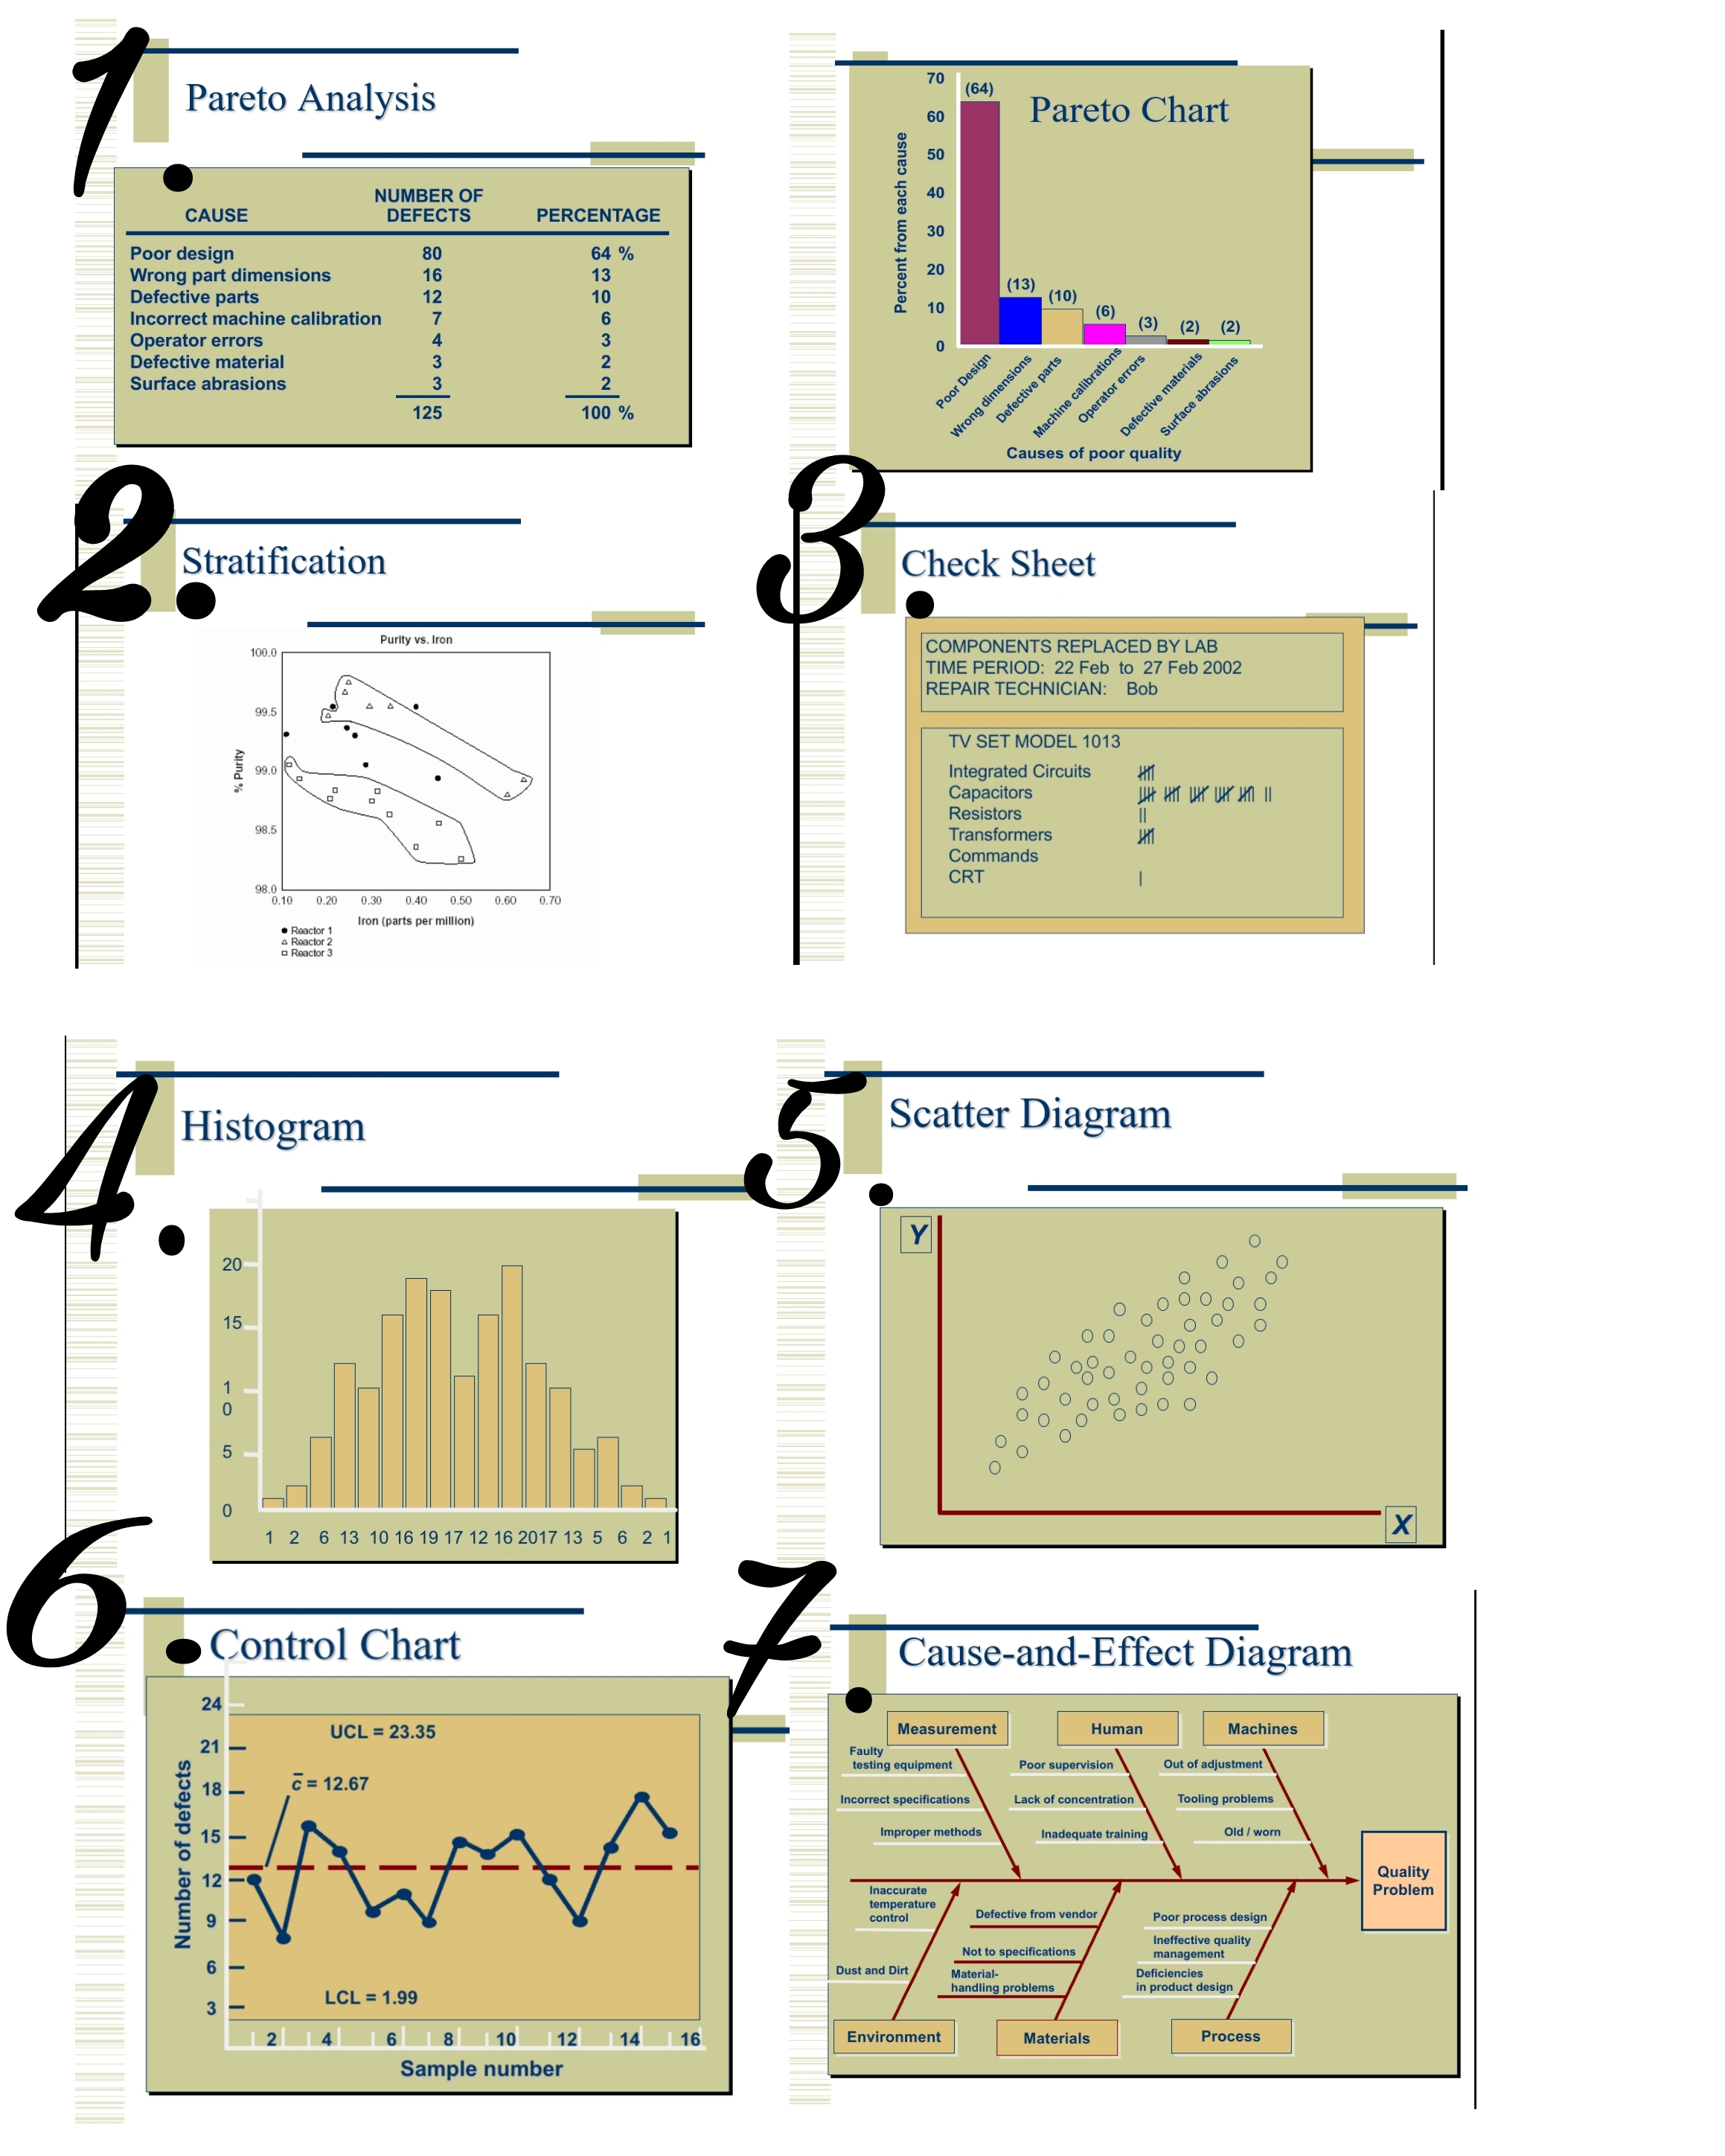
Pareto Analysis 70 (64) Pareto Chart NUMBER OF CAUSE DEFECTS PERCENTAGE Percent from each cause Poor design 80 14 % Wrong part dimensions 13 Defective parts 10 Incorrect machine calibration (13) (10) (6 ) ( 3 ) ( 2 ) ( 2 ) Operator errors o i WWAVNO NN WOC Defective material Surface abrasions 100 % Causes of poor quality 2 Stratification Check Sheet Purity vs. Iron 100.0 COMPONENTS REPLACED BY LAB TIME PERIOD: 22 Feb to 27 Feb 2002 REPAIR TECHNICIAN: Bob 29.5 TV SET MODEL 1013 % Purity 99.0 Integrated Circuits Capacitors H HIT LAY UX *n 11 Resistors Transformers Commands CRT 0.10 0.20 0.30 0.40 0.50 0.60 0.70 . Reactor Iron (parts per million) a Reactor Histogram Scatter Diagram Y 20 O 15 O o o 10 0 O O - O 5 OC O 0 1 2 6 13 10 16 19 17 12 16 2017 13 5 6 2 1 X 6 Control Chart TN Cause-and-Effect Diagram 24 UCL = 23.3 Measurement Human Machines 21 - Faulty testing equipment Poor supervision Out of adjustment C = 12.67 Incorrect specifications Lack of concentration Tooling problems Improper methods Inadequate training Old / worn Number of defects Quality temperature Problem control Defective from vendo Poor process design Ineffective quality Not to specifications management Dust and Dirt Material- Deficiencies handling problems in product design 3 LCL = 1.99 6 8 10 12 14 16 Environment Materials Process Sample number
Step by Step Solution
There are 3 Steps involved in it

Get step-by-step solutions from verified subject matter experts