

Question: 1. By graphing the NPV profiles for Plan A and Plan B, approximate the crossover rate to the nearest percent. fill in the blank _____%
1. By graphing the NPV profiles for Plan A and Plan B, approximate the crossover rate to the nearest percent.
fill in the blank _____%
2. Calculate the crossover rate where the two projects' NPVs are equal. Round your answer to two decimal places.
fill in the blank _____%
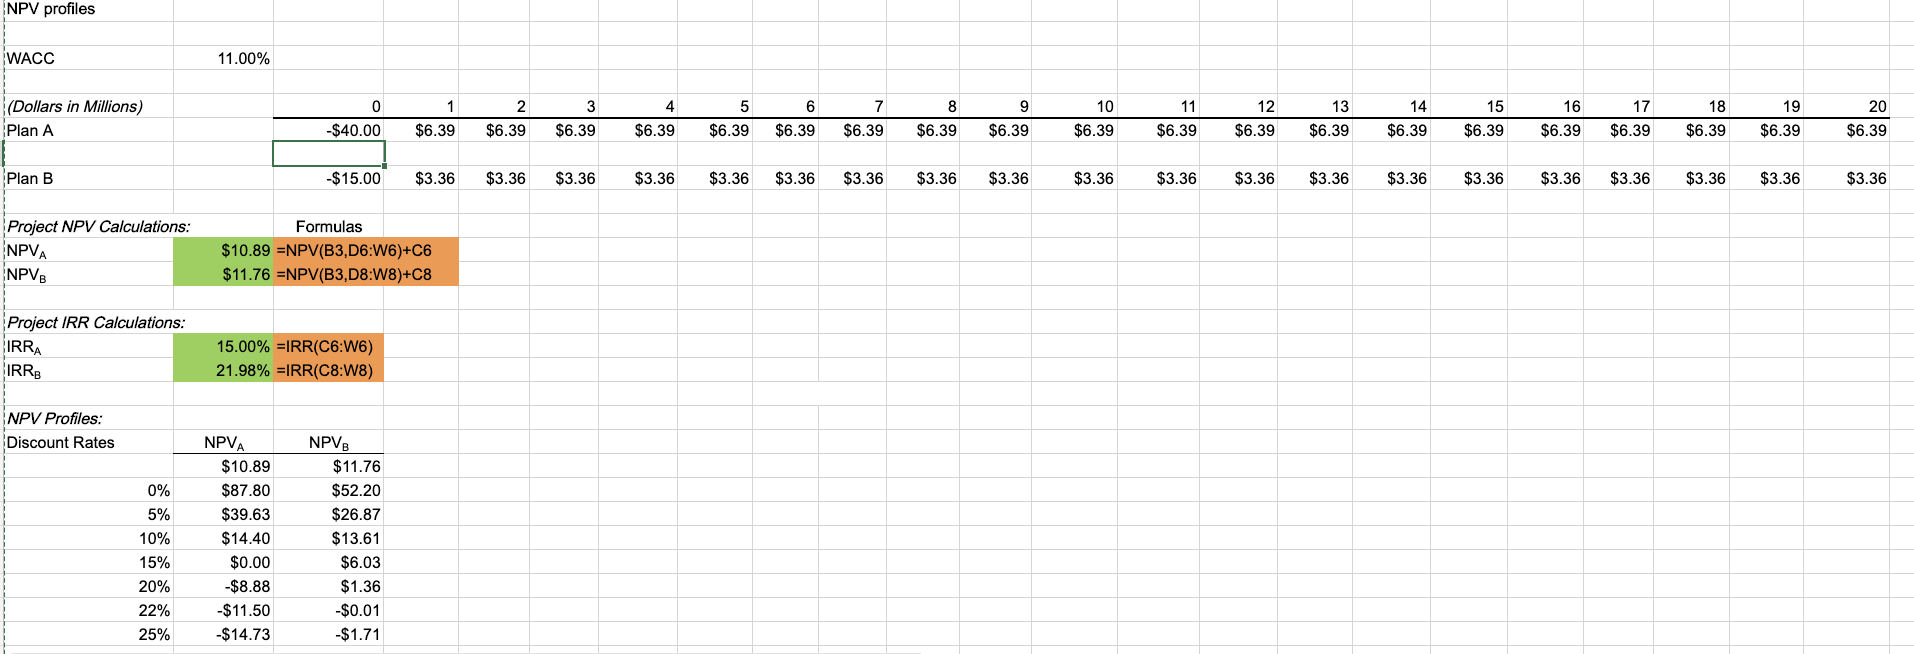
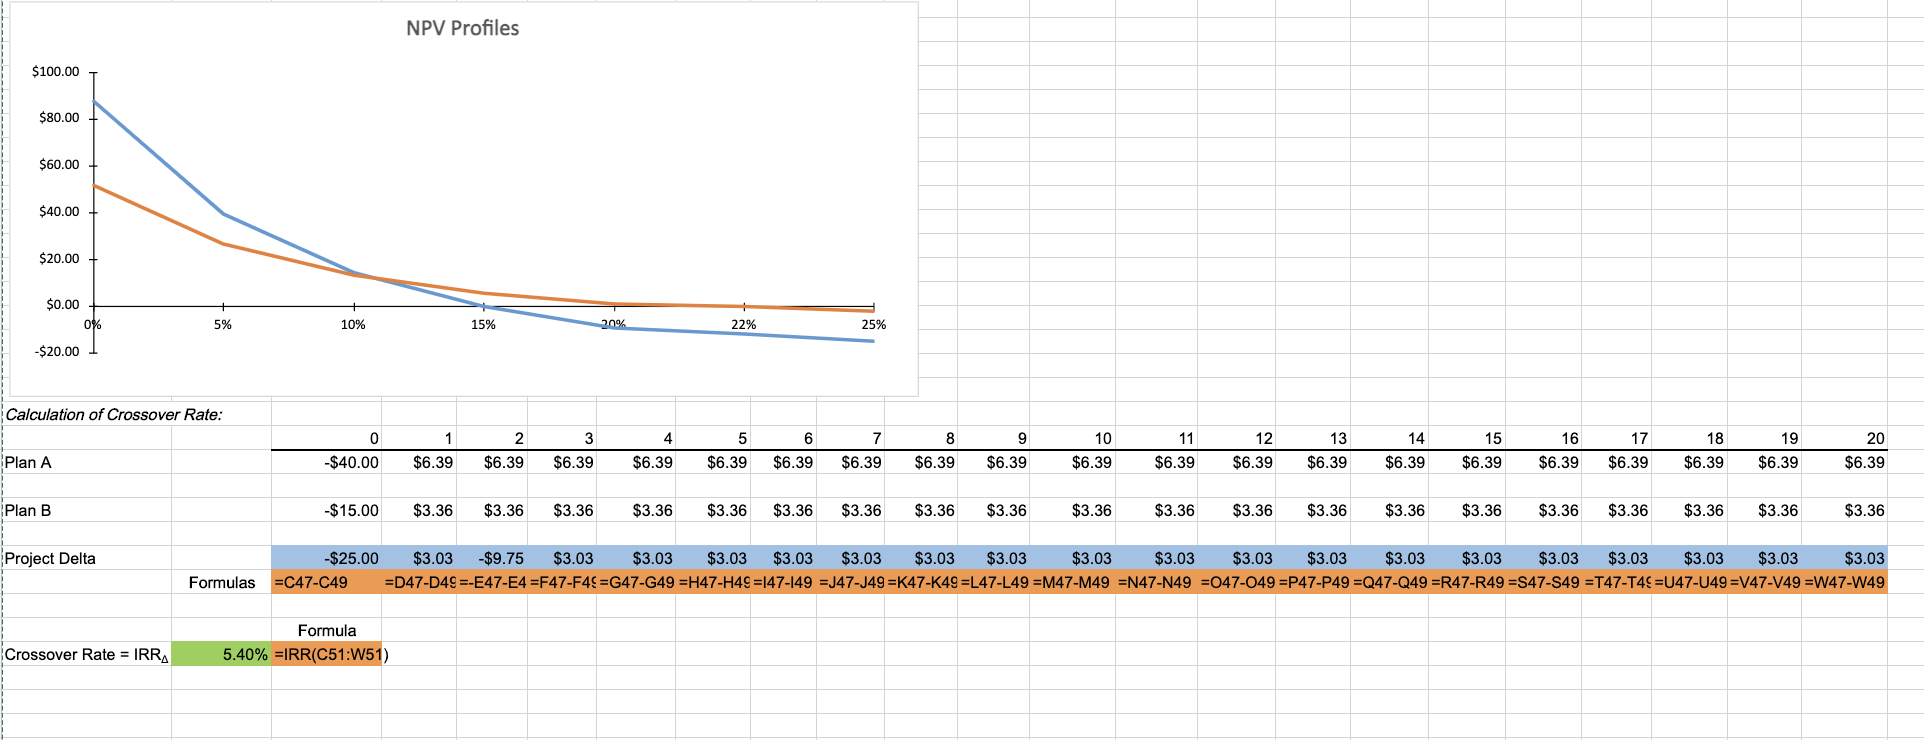
NPV profiles (Dollars in Millions) 3 \begin{tabular}{lc|c} Project NPV Calculations: & Formulas \\ NPVA & $10.89=NPV(B3,D6:W6)+C6 \\ NPVB & $11.76=NPV(B3,D8:W8)+C8 \end{tabular} NPV Profiles Calculation of Crossover Rate: NPV profiles (Dollars in Millions) 3 \begin{tabular}{lc|c} Project NPV Calculations: & Formulas \\ NPVA & $10.89=NPV(B3,D6:W6)+C6 \\ NPVB & $11.76=NPV(B3,D8:W8)+C8 \end{tabular} NPV Profiles Calculation of Crossover Rate
Step by Step Solution
There are 3 Steps involved in it

Get step-by-step solutions from verified subject matter experts