

Question: 1) Calculate Return on Capital, Return on Assets, and Return on Equity for 2017, 2018 and 2019 2) Calculate Asset Turnover Ratio, Inventory Turnover Ratio,
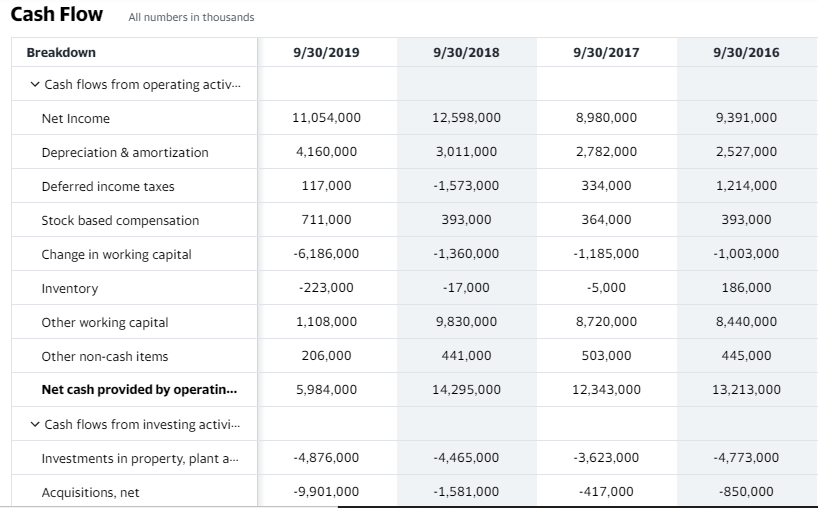
1) Calculate Return on Capital, Return on Assets, and Return on Equity for 2017, 2018 and 2019
2) Calculate Asset Turnover Ratio, Inventory Turnover Ratio, and Receivables Turnover Ratio for 2017, 2018 and 2019
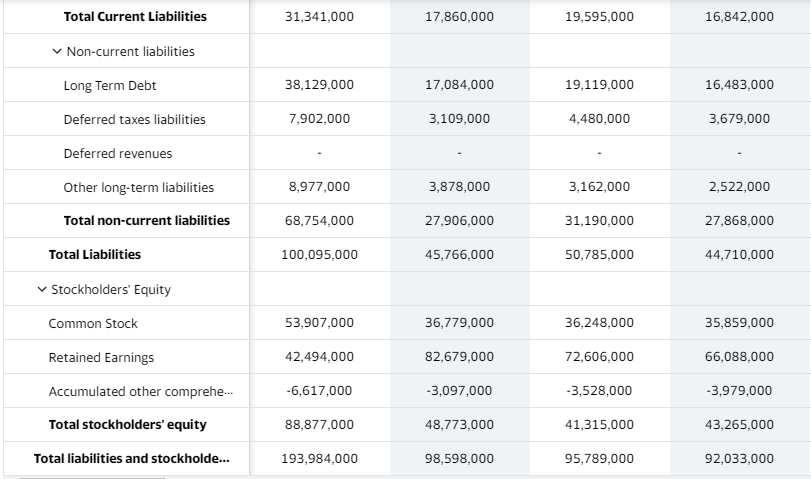
3) Calculate Long-term debt ratio and Long-term debt to equity ratio for 2017, 2018 and 2019
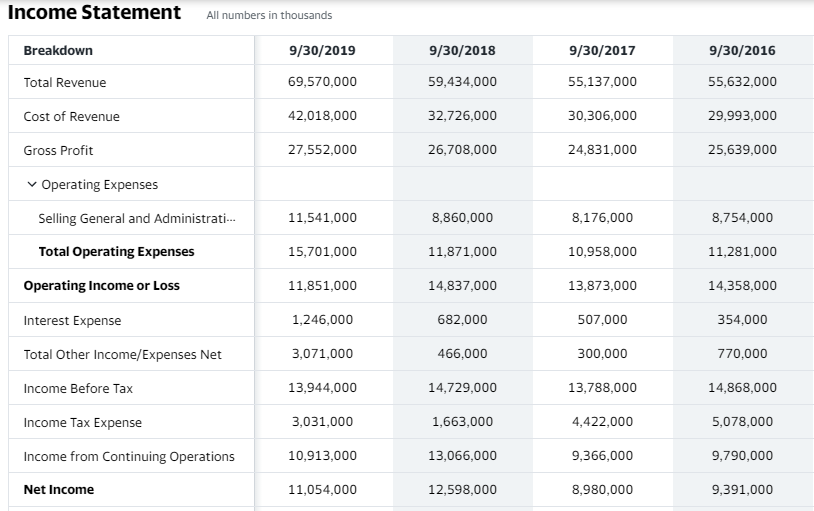
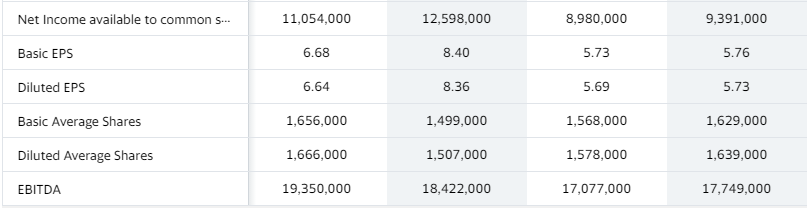
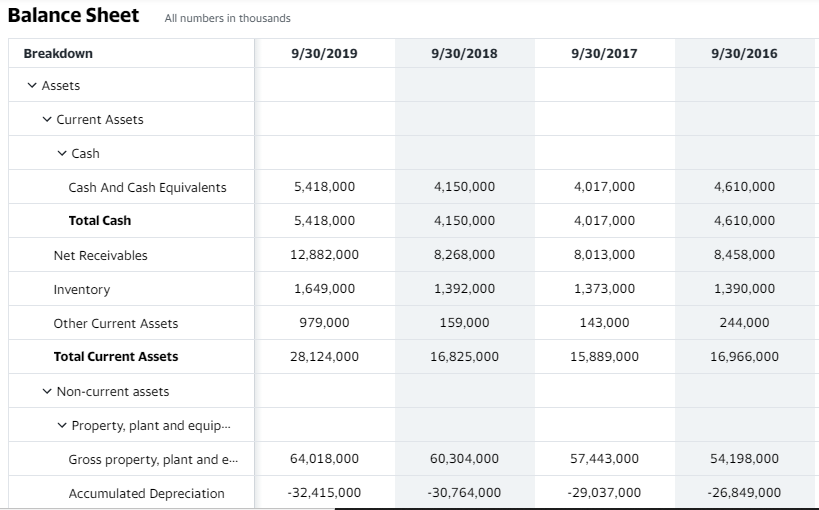
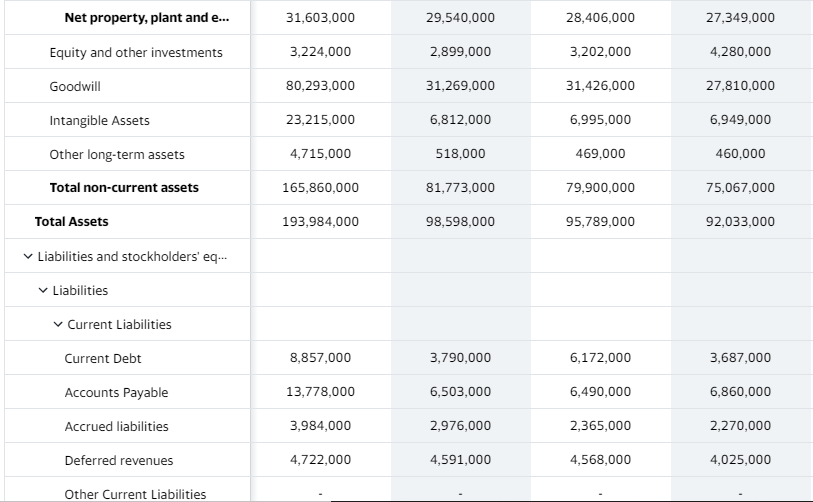
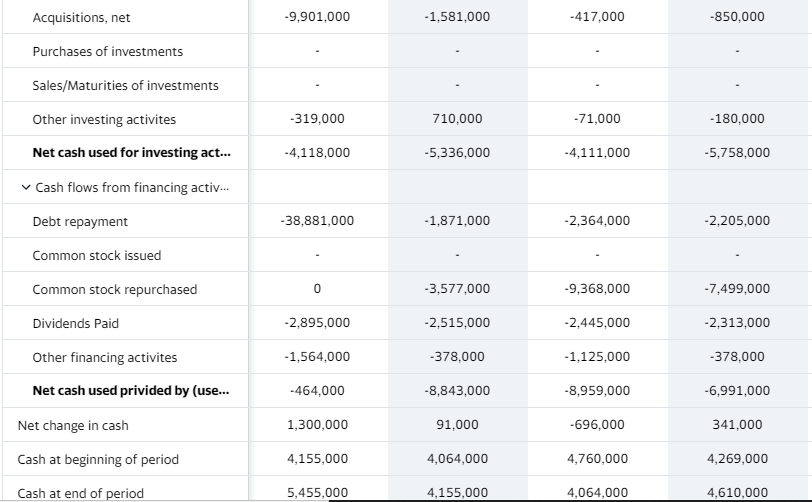
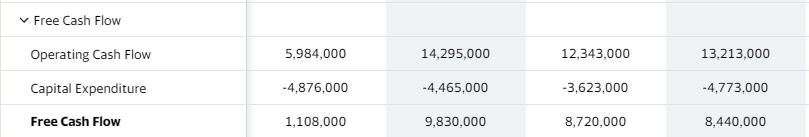
Income Statement All numbers in thousands Breakdown 9/30/2019 9/30/2018 9/30/2017 9/30/2016 Total Revenue 69,570,000 59,434,000 55,137,000 55,632,000 Cost of Revenue 42,018,000 32,726,000 30,306,000 29,993,000 Gross Profit 27,552,000 26,708,000 24,831,000 25,639,000 Operating Expenses Selling General and Administrati... 11,541,000 8,860,000 8,176,000 8,754,000 Total Operating Expenses 15,701,000 11,871,000 10,958,000 11,281,000 Operating Income or Loss 11,851,000 14,837,000 13,873,000 14,358,000 Interest Expense 1,246,000 682,000 507,000 354,000 Total Other Income/Expenses Net 3,071,000 466,000 300,000 770,000 Income Before Tax 13,944,000 14,729,000 13,788,000 14,868,000 Income Tax Expense 3,031,000 1,663,000 4,422,000 5,078,000 Income from Continuing Operations 10,913,000 13,066,000 9,366,000 9,790,000 Net Income 11,054,000 12,598,000 8,980,000 9,391,000 Net Income available to common S... 11,054,000 12,598,000 8,980,000 9,391,000 Basic EPS 6.68 8.40 5.73 5.76 Diluted EPS 6.64 8.36 5.69 5.73 Basic Average Shares 1,656,000 1,499,000 1,568,000 1,629,000 Diluted Average Shares 1,666,000 1,507,000 1,578,000 1,639,000 EBITDA 19,350,000 18,422,000 17,077,000 17,749,000 Balance Sheet All numbers in thousands Breakdown 9/30/2019 9/30/2018 9/30/2017 9/30/2016 Assets Current Assets Cash Cash And Cash Equivalents 5,418,000 4,150,000 4,017,000 4,610,000 Total Cash 5,418,000 4,150,000 4,017,000 4,610,000 Net Receivables 12,882,000 8,268,000 8,013,000 8,458,000 Inventory 1,649,000 1,392,000 1,373,000 1,390,000 Other Current Assets 979,000 159,000 143,000 244,000 Total Current Assets 28,124,000 16,825,000 15,889,000 16,966,000 Non-current assets Property, plant and equip... Gross property, plant and e... 64,018,000 60,304,000 57,443,000 54,198,000 Accumulated Depreciation -32,415,000 -30,764,000 -29,037,000 -26,849,000 Net property, plant and e... 31,603,000 29,540,000 28,406,000 27,349,000 Equity and other investments 3,224,000 2,899,000 3,202,000 4,280,000 Goodwill 80,293,000 31,269,000 31,426,000 27,810,000 Intangible Assets 23,215,000 6,812,000 6,995,000 6,949,000 Other long-term assets 4,715,000 518,000 469,000 460,000 Total non-current assets 165,860,000 81,773,000 79,900,000 75,067,000 Total Assets 193,984,000 98,598,000 95,789,000 92,033,000 Liabilities and stockholders' eq... Liabilities Current Liabilities Current Debt 8,857,000 3,790,000 6,172,000 3,687,000 Accounts Payable 13,778,000 6,503,000 6,490,000 6,860,000 Accrued liabilities 3,984,000 2,976,000 2,365,000 2,270,000 Deferred revenues 4,722,000 4,591,000 4,568,000 4,025,000 Other Current Liabilities Total Current Liabilities 31,341,000 17,860,000 19,595,000 16,842,000 Non-current liabilities Long Term Debt 38,129,000 17,084,000 19,119,000 16,483,000 Deferred taxes liabilities 7,902,000 3,109,000 4,480,000 3,679,000 Deferred revenues Other long-term liabilities 8,977,000 3,878,000 3,162,000 2,522,000 Total non-current liabilities 68,754,000 27,906,000 31,190,000 27,868,000 Total Liabilities 100,095,000 45,766,000 50,785,000 44,710,000 Stockholders' Equity Common Stock 53,907,000 36,779,000 36,248,000 35,859,000 Retained Earnings 42,494,000 82,679,000 72,606,000 66,088,000 Accumulated other comprehe... -6,617,000 -3,097,000 -3,528,000 -3,979,000 Total stockholders' equity 88,877,000 48,773,000 41,315,000 43,265,000 Total liabilities and stockholde... 193,984,000 98,598,000 95,789,000 92,033,000 Cash Flow All numbers in thousands Breakdown 9/30/2019 9/30/2018 9/30/2017 9/30/2016 Cash flows from operating activ... Net Income 11,054,000 12,598,000 8,980,000 9,391,000 Depreciation & amortization 4,160,000 3,011,000 2,782,000 2,527,000 Deferred income taxes 117,000 -1,573,000 334.000 1,214,000 Stock based compensation 711,000 393,000 364,000 393,000 Change in working capital -6,186,000 -1,360,000 -1,185,000 -1,003,000 Inventory -223,000 -17,000 -5,000 186,000 Other working capital 1,108,000 9,830,000 8,720,000 8,440,000 Other non-cash items 206,000 441,000 503,000 445,000 Net cash provided by operatin... 5,984,000 14,295,000 12,343,000 13,213,000 Cash flows from investing activi... Investments in property, plant a... -4,876,000 -4,465,000 -3,623,000 -4,773,000 Acquisitions, net -9,901,000 -1,581,000 - 417,000 -850,000 Acquisitions, net -9,901,000 -1,581,000 -417,000 -850,000 Purchases of investments Sales/Maturities of investments Other investing activites -319,000 710,000 -71,000 -180,000 Net cash used for investing act... -4,118,000 -5,336,000 -4,111,000 -5,758,000 Cash flows from financing activ... Debt repayment -38,881,000 -1,871,000 -2,364,000 -2,205,000 Common stock issued Common stock repurchased -3,577,000 -9,368,000 -7,499,000 Dividends Paid -2,895,000 -2,515,000 -2,445,000 -2,313,000 Other financing activites -1,564,000 -378,000 - 1,125,000 -378,000 Net cash used privided by (use... - 464,000 -8,843,000 -8,959,000 -6,991,000 Net change in cash 1,300,000 91,000 -696,000 341,000 Cash at beginning of period 4,155,000 4,064,000 4,760,000 4,269,000 Cash at end of period 5,455,000 4,155,000 4,064,000 4,610,000 Free Cash Flow Operating Cash Flow 5,984,000 14,295,000 12,343,000 13,213,000 Capital Expenditure -4,876,000 -4,465,000 -3,623,000 -4,773,000 Free Cash Flow 1,108,000 9.830,000 8,720,000 8,440,000 Income Statement All numbers in thousands Breakdown 9/30/2019 9/30/2018 9/30/2017 9/30/2016 Total Revenue 69,570,000 59,434,000 55,137,000 55,632,000 Cost of Revenue 42,018,000 32,726,000 30,306,000 29,993,000 Gross Profit 27,552,000 26,708,000 24,831,000 25,639,000 Operating Expenses Selling General and Administrati... 11,541,000 8,860,000 8,176,000 8,754,000 Total Operating Expenses 15,701,000 11,871,000 10,958,000 11,281,000 Operating Income or Loss 11,851,000 14,837,000 13,873,000 14,358,000 Interest Expense 1,246,000 682,000 507,000 354,000 Total Other Income/Expenses Net 3,071,000 466,000 300,000 770,000 Income Before Tax 13,944,000 14,729,000 13,788,000 14,868,000 Income Tax Expense 3,031,000 1,663,000 4,422,000 5,078,000 Income from Continuing Operations 10,913,000 13,066,000 9,366,000 9,790,000 Net Income 11,054,000 12,598,000 8,980,000 9,391,000 Net Income available to common S... 11,054,000 12,598,000 8,980,000 9,391,000 Basic EPS 6.68 8.40 5.73 5.76 Diluted EPS 6.64 8.36 5.69 5.73 Basic Average Shares 1,656,000 1,499,000 1,568,000 1,629,000 Diluted Average Shares 1,666,000 1,507,000 1,578,000 1,639,000 EBITDA 19,350,000 18,422,000 17,077,000 17,749,000 Balance Sheet All numbers in thousands Breakdown 9/30/2019 9/30/2018 9/30/2017 9/30/2016 Assets Current Assets Cash Cash And Cash Equivalents 5,418,000 4,150,000 4,017,000 4,610,000 Total Cash 5,418,000 4,150,000 4,017,000 4,610,000 Net Receivables 12,882,000 8,268,000 8,013,000 8,458,000 Inventory 1,649,000 1,392,000 1,373,000 1,390,000 Other Current Assets 979,000 159,000 143,000 244,000 Total Current Assets 28,124,000 16,825,000 15,889,000 16,966,000 Non-current assets Property, plant and equip... Gross property, plant and e... 64,018,000 60,304,000 57,443,000 54,198,000 Accumulated Depreciation -32,415,000 -30,764,000 -29,037,000 -26,849,000 Net property, plant and e... 31,603,000 29,540,000 28,406,000 27,349,000 Equity and other investments 3,224,000 2,899,000 3,202,000 4,280,000 Goodwill 80,293,000 31,269,000 31,426,000 27,810,000 Intangible Assets 23,215,000 6,812,000 6,995,000 6,949,000 Other long-term assets 4,715,000 518,000 469,000 460,000 Total non-current assets 165,860,000 81,773,000 79,900,000 75,067,000 Total Assets 193,984,000 98,598,000 95,789,000 92,033,000 Liabilities and stockholders' eq... Liabilities Current Liabilities Current Debt 8,857,000 3,790,000 6,172,000 3,687,000 Accounts Payable 13,778,000 6,503,000 6,490,000 6,860,000 Accrued liabilities 3,984,000 2,976,000 2,365,000 2,270,000 Deferred revenues 4,722,000 4,591,000 4,568,000 4,025,000 Other Current Liabilities Total Current Liabilities 31,341,000 17,860,000 19,595,000 16,842,000 Non-current liabilities Long Term Debt 38,129,000 17,084,000 19,119,000 16,483,000 Deferred taxes liabilities 7,902,000 3,109,000 4,480,000 3,679,000 Deferred revenues Other long-term liabilities 8,977,000 3,878,000 3,162,000 2,522,000 Total non-current liabilities 68,754,000 27,906,000 31,190,000 27,868,000 Total Liabilities 100,095,000 45,766,000 50,785,000 44,710,000 Stockholders' Equity Common Stock 53,907,000 36,779,000 36,248,000 35,859,000 Retained Earnings 42,494,000 82,679,000 72,606,000 66,088,000 Accumulated other comprehe... -6,617,000 -3,097,000 -3,528,000 -3,979,000 Total stockholders' equity 88,877,000 48,773,000 41,315,000 43,265,000 Total liabilities and stockholde... 193,984,000 98,598,000 95,789,000 92,033,000 Cash Flow All numbers in thousands Breakdown 9/30/2019 9/30/2018 9/30/2017 9/30/2016 Cash flows from operating activ... Net Income 11,054,000 12,598,000 8,980,000 9,391,000 Depreciation & amortization 4,160,000 3,011,000 2,782,000 2,527,000 Deferred income taxes 117,000 -1,573,000 334.000 1,214,000 Stock based compensation 711,000 393,000 364,000 393,000 Change in working capital -6,186,000 -1,360,000 -1,185,000 -1,003,000 Inventory -223,000 -17,000 -5,000 186,000 Other working capital 1,108,000 9,830,000 8,720,000 8,440,000 Other non-cash items 206,000 441,000 503,000 445,000 Net cash provided by operatin... 5,984,000 14,295,000 12,343,000 13,213,000 Cash flows from investing activi... Investments in property, plant a... -4,876,000 -4,465,000 -3,623,000 -4,773,000 Acquisitions, net -9,901,000 -1,581,000 - 417,000 -850,000 Acquisitions, net -9,901,000 -1,581,000 -417,000 -850,000 Purchases of investments Sales/Maturities of investments Other investing activites -319,000 710,000 -71,000 -180,000 Net cash used for investing act... -4,118,000 -5,336,000 -4,111,000 -5,758,000 Cash flows from financing activ... Debt repayment -38,881,000 -1,871,000 -2,364,000 -2,205,000 Common stock issued Common stock repurchased -3,577,000 -9,368,000 -7,499,000 Dividends Paid -2,895,000 -2,515,000 -2,445,000 -2,313,000 Other financing activites -1,564,000 -378,000 - 1,125,000 -378,000 Net cash used privided by (use... - 464,000 -8,843,000 -8,959,000 -6,991,000 Net change in cash 1,300,000 91,000 -696,000 341,000 Cash at beginning of period 4,155,000 4,064,000 4,760,000 4,269,000 Cash at end of period 5,455,000 4,155,000 4,064,000 4,610,000 Free Cash Flow Operating Cash Flow 5,984,000 14,295,000 12,343,000 13,213,000 Capital Expenditure -4,876,000 -4,465,000 -3,623,000 -4,773,000 Free Cash Flow 1,108,000 9.830,000 8,720,000 8,440,000
Step by Step Solution
There are 3 Steps involved in it

Get step-by-step solutions from verified subject matter experts