

Question: 1) Calculate the average length for each age class and plot the result. What are your comments? 2) Estimate the K and Linf parameters using
1) Calculate the average length for each age class and plot the result. What are your comments? 2) Estimate the K and Linf parameters using the The Gulland and Holt method (c.f. FAO document provided on Blackboard for guidance)
 3) Estimate the t0 parameter using the The von Bertalanffy plot. Considerer the Linf estimated with the Gulland and Holt method in the previous question. (c.f. FAO document provided on Blackboard for guidance) 4) Optional (At home): Estimate the Von Bertalanffy growth parameters using the subroutine Solver into EXCEL. a. Use the average length for each age class matrix calculated in 1) b. Calculate the estimated average length using the von Bertalanffy equation in EXCEL (=Linf*(1-EXP(-K*(t - t0))) c. Use the subroutine Solver in EXCEL to estimate VBGF coefficients using the least square methods. Introduce the initial values for the K, Linf, and t0 estimated with the graphical methods.
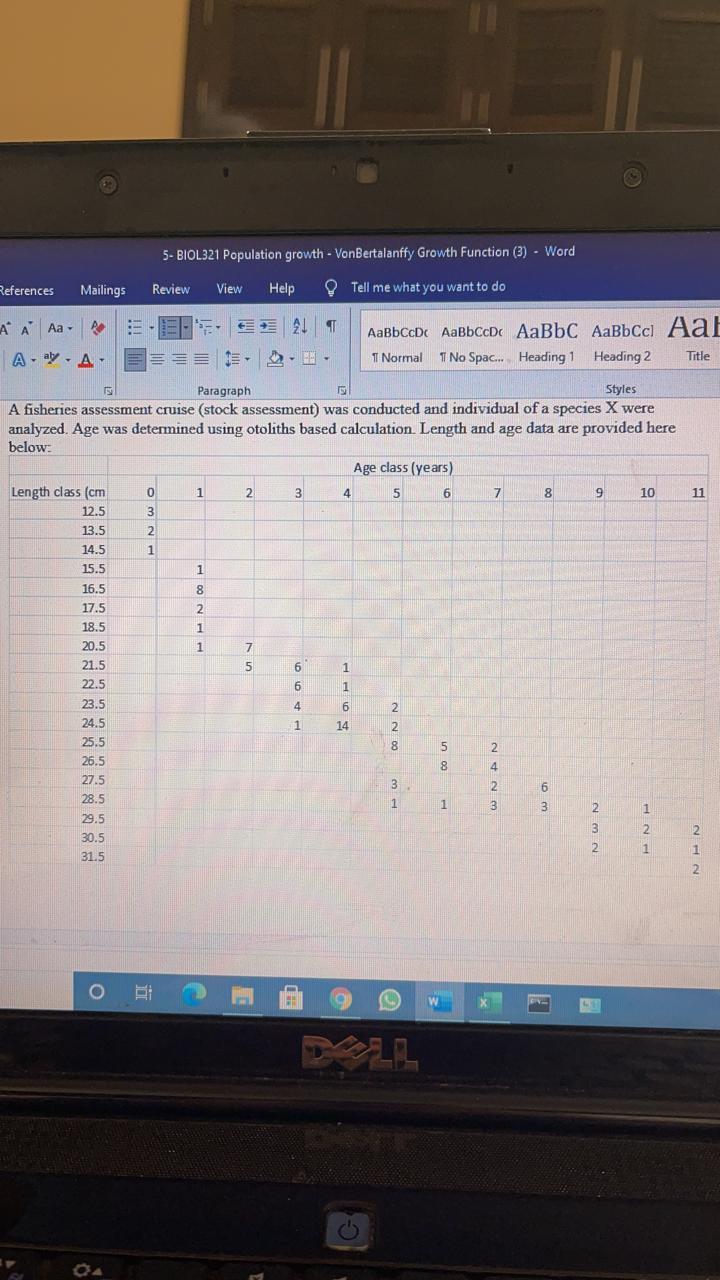
5- BIOL321 Population growth - VonBertalanffy Growth Function (3) - Word References Mailings Review View Help Tell me what you want to do A A Aa A AaBbCcDc Aabbccd AaBbC AaBbcci Aal 1 Normal 1 No Spac... Heading 1 Heading 2 A-ay - A- ==== - Title IS Paragraph Styles A fisheries assessment cruise (stock assessment) was conducted and individual of a species X were analyzed. Age was determined using otoliths based calculation Length and age data are provided here below: Age class (years) Length class (cm 0 1 3 6 7 9 10 12.5 13.5 2 4 5 8 11 3 2 1 1 8 2 1 1 7 5 6 1 6 1 14.5 15.5 16.5 17.5 18.5 20.5 21.5 22.5 23.5 24.5 25.5 26.5 27.5 28.5 29.5 30.5 31.5 4 1 6 14 2 8 2 5 8 4 6 3 1 2 3 1 3 1 2 2 3 2 2 2 1 1 2 O 5- BIOL321 Population growth - VonBertalanffy Growth Function (3) - Word References Mailings Review View Help Tell me what you want to do A A Aa A AaBbCcDc Aabbccd AaBbC AaBbcci Aal 1 Normal 1 No Spac... Heading 1 Heading 2 A-ay - A- ==== - Title IS Paragraph Styles A fisheries assessment cruise (stock assessment) was conducted and individual of a species X were analyzed. Age was determined using otoliths based calculation Length and age data are provided here below: Age class (years) Length class (cm 0 1 3 6 7 9 10 12.5 13.5 2 4 5 8 11 3 2 1 1 8 2 1 1 7 5 6 1 6 1 14.5 15.5 16.5 17.5 18.5 20.5 21.5 22.5 23.5 24.5 25.5 26.5 27.5 28.5 29.5 30.5 31.5 4 1 6 14 2 8 2 5 8 4 6 3 1 2 3 1 3 1 2 2 3 2 2 2 1 1 2 O
Step by Step Solution
There are 3 Steps involved in it

Get step-by-step solutions from verified subject matter experts