

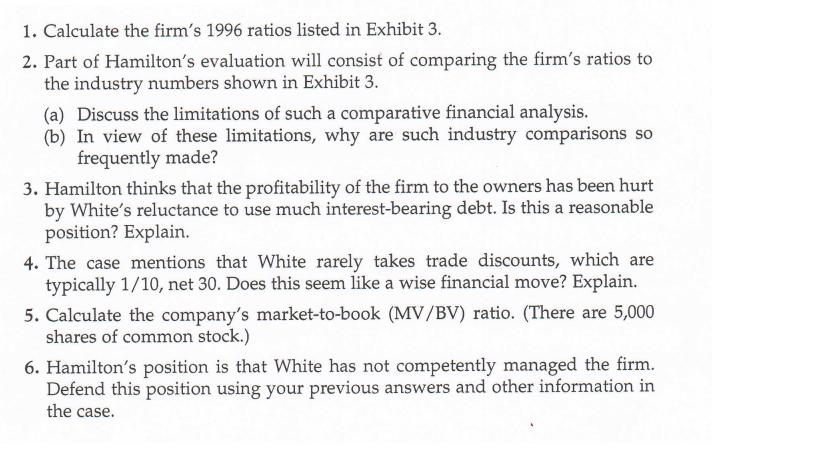
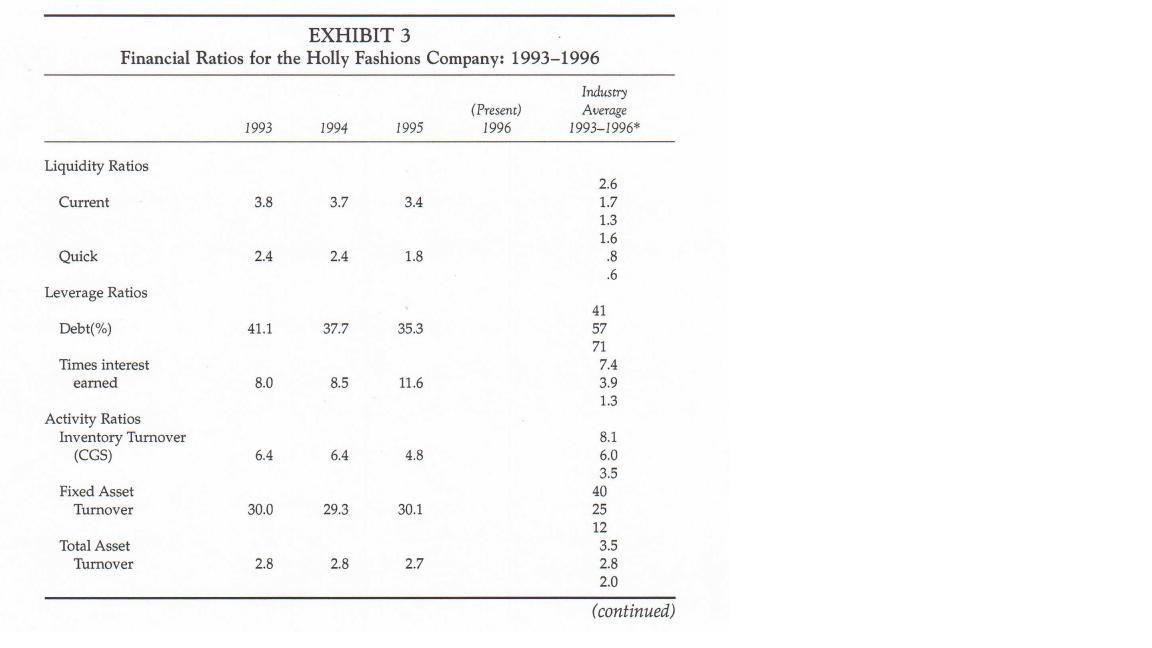
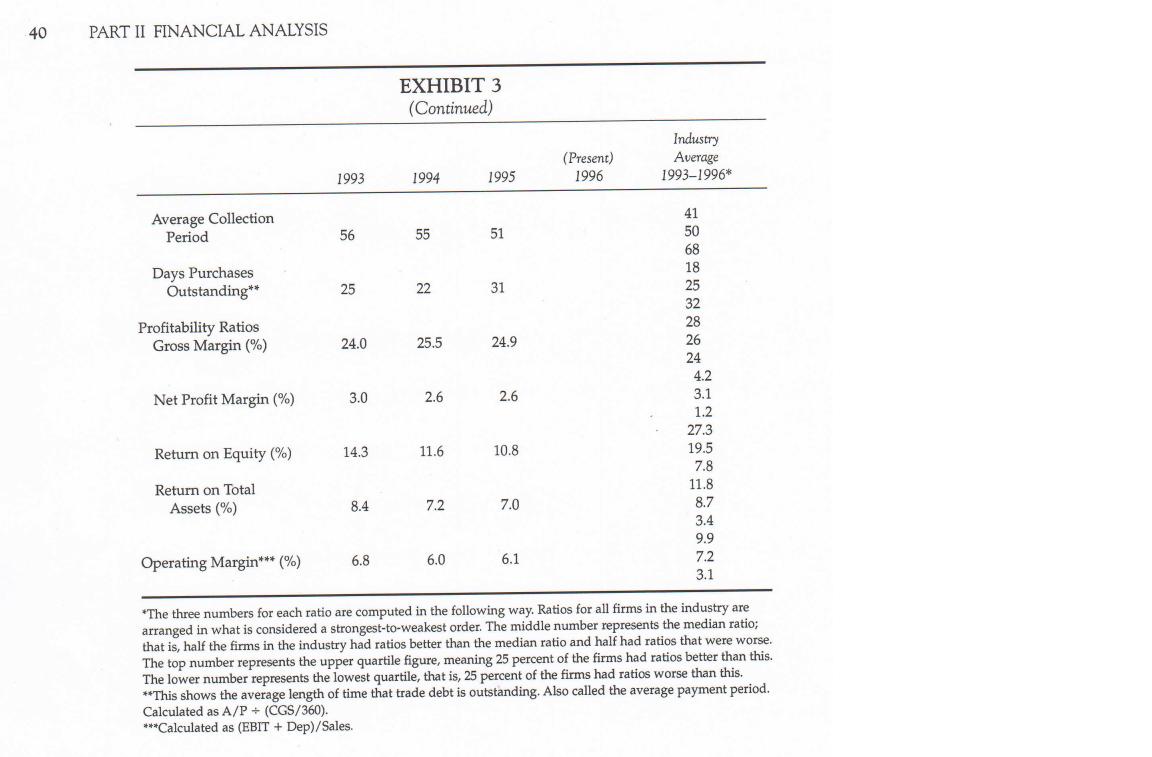
1. Calculate the firm's 1996 ratios listed in Exhibit 3. 2. Part of Hamilton's evaluation will...
Fantastic news! We've Found the answer you've been seeking!
Question:
Transcribed Image Text:
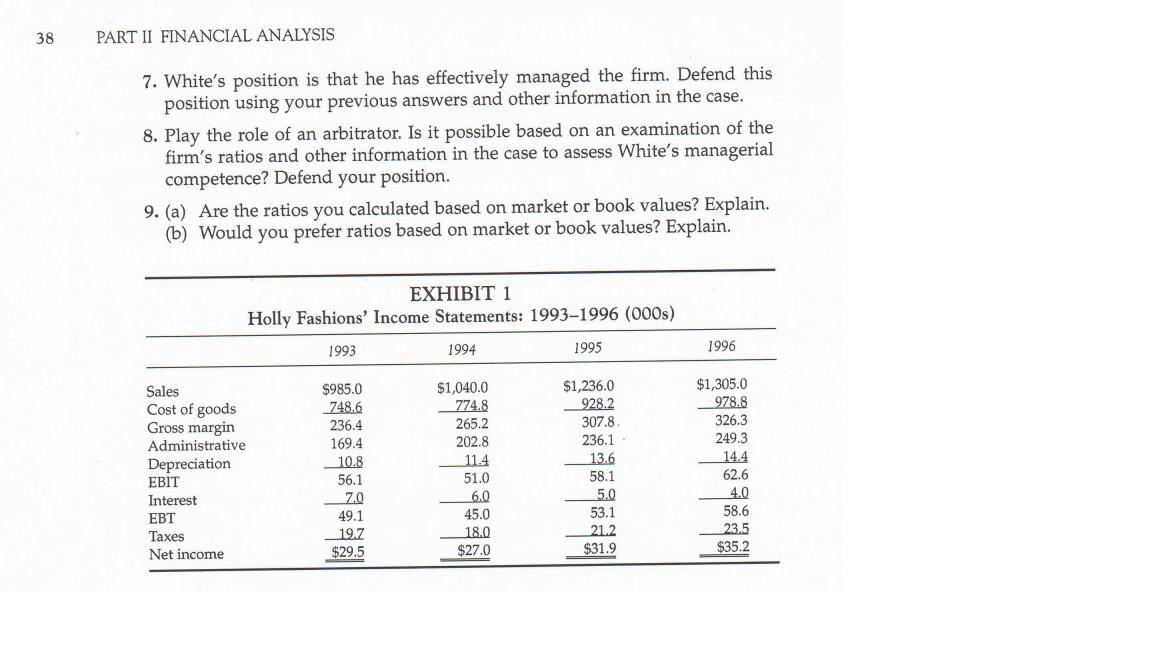
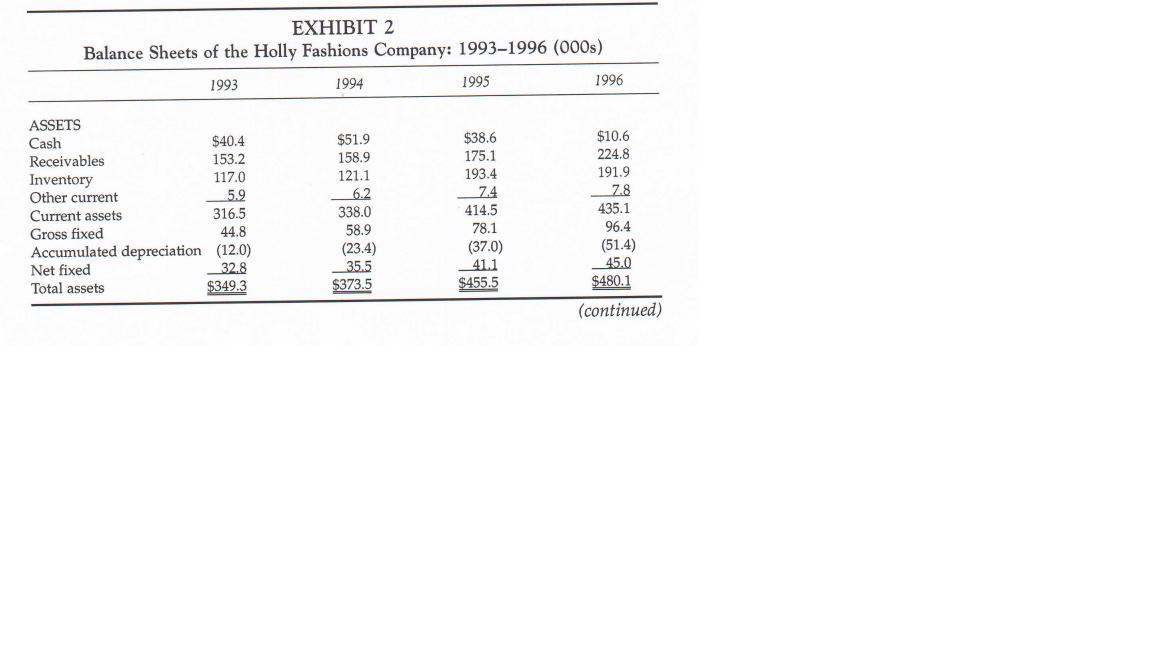
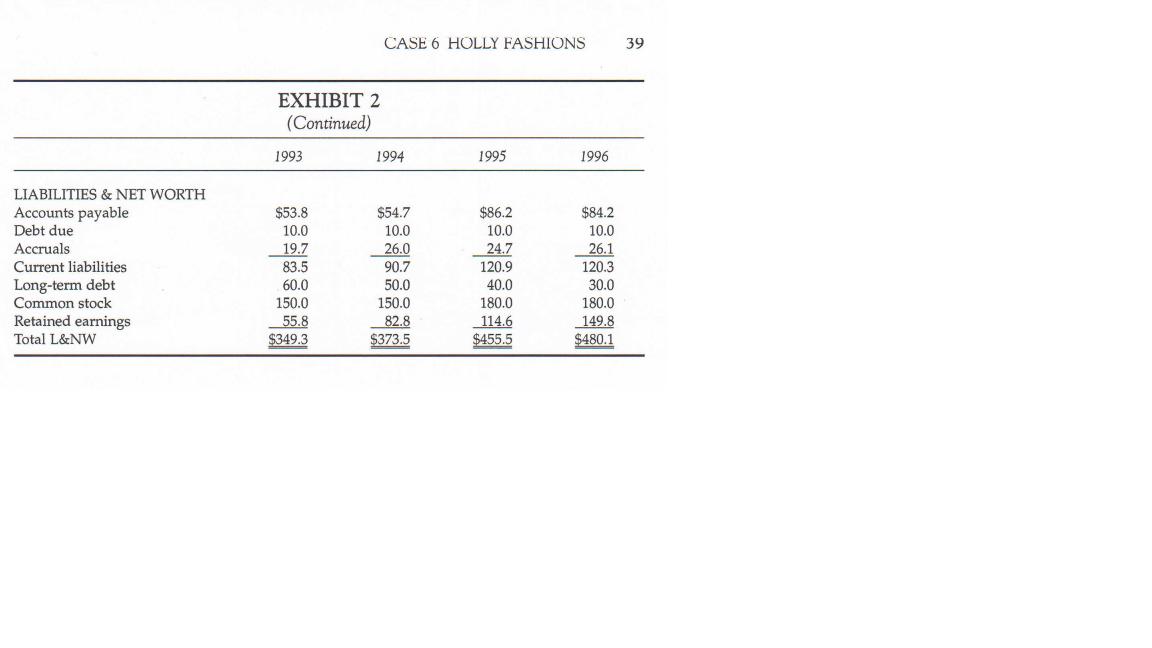
1. Calculate the firm's 1996 ratios listed in Exhibit 3. 2. Part of Hamilton's evaluation will consist of comparing the firm's ratios to the industry numbers shown in Exhibit 3. (a) Discuss the limitations of such a comparative financial analysis. (b) In view of these limitations, why are such industry comparisons so frequently made? 3. Hamilton thinks that the profitability of the firm to the owners has been hurt by White's reluctance to use much interest-bearing debt. Is this a reasonable position? Explain. 4. The case mentions that White rarely takes trade discounts, which are typically 1/10, net 30. Does this seem like a wise financial move? Explain. 5. Calculate the company's market-to-book (MV/BV) ratio. (There are 5,000 shares of common stock.) 6. Hamilton's position is that White has not competently managed the firm. Defend this position using your previous answers and other information in the case. 38 PART II FINANCIAL ANALYSIS 7. White's position is that he has effectively managed the firm. Defend this position using your previous answers and other information in the case. 8. Play the role of an arbitrator. Is it possible based on an examination of the firm's ratios and other information in the case to assess White's managerial competence? Defend your position. 9. (a) Are the ratios you calculated based on market or book values? Explain. (b) Would you prefer ratios based on market or book values? Explain. Sales Cost of goods Gross margin Administrative Depreciation EBIT Interest EBT Taxes Net income EXHIBIT 1 Holly Fashions' Income Statements: 1993-1996 (000s) 1993 1995 $985.0 748.6 236.4 169.4 10.8 56.1 7.0 49.1 19.7 $29.5 1994 $1,040.0 774.8 265.2 202.8 11.4 51.0 6.0 45.0 18.0 $27.0 $1,236.0 928.2 307.8 236.1 13.6 58.1 5.0 53.1 21.2 $31.9 1996 $1,305.0 978.8 326.3 249.3 14.4 62.6 4.0 58.6 23.5 $35.2 ASSETS Cash EXHIBIT 2 Balance Sheets of the Holly Fashions Company: 1993-1996 (000s) 1993 Receivables Inventory Other current Current assets Gross fixed $40.4 153.2 117.0 5.9 316.5 44.8 Accumulated depreciation (12.0) Net fixed 32.8 Total assets $349.3 1994 $51.9 158.9 121.1 6.2 338.0 58.9 (23.4) 35.5 $373.5 1995 $38.6 175.1 193.4 7.4 414.5 78.1 (37.0) 41.1 $455.5 1996 $10.6 224.8 191.9 7.8 435.1 96.4 (51.4) 45.0 $480.1 (continued) LIABILITIES & NET WORTH Accounts payable Debt due Accruals Current liabilities Long-term debt Common stock Retained earnings Total L&NW EXHIBIT 2 (Continued) 1993 $53.8 10.0 19.7 83.5 60.0 150.0 55.8 $349.3 CASE 6 HOLLY FASHIONS 1994 $54.7 10.0 26.0 90.7 50.0 150.0 82.8 $373.5 1995 $86.2 10.0 24.7 120.9 40.0 180.0 114.6 $455.5 1996 $84.2 10.0 26.1 120.3 30.0 180.0 149.8 $480.1 39 EXHIBIT 3 Financial Ratios for the Holly Fashions Company: 1993-1996 Liquidity Ratios Current Quick Leverage Ratios Debt(%) Times interest earned Activity Ratios Inventory Turnover (CGS) Fixed Asset Turnover Total Asset Turnover 1993 3.8 2.4 41.1 8.0 6.4 30.0 2.8 1994 3.7 2.4 37.7 8.5 6.4 29.3 2.8 1995 3.4 1.8 35.3 11.6 4.8 30.1 2.7 (Present) 1996 Industry Average 1993-1996* 2.6 1.7 1.3 1.6 .8 .6 41 57 71 7.4 3.9 1.3. 8.1 6.0 3.5 40 25 12 3.5 2.8 2.0 (continued) 40 PART II FINANCIAL ANALYSIS Average Collection Period Days Purchases Outstanding** Profitability Ratios Gross Margin (%) Net Profit Margin (%) Return on Equity (%) Return on Total Assets (%) Operating Margin*** (%) 1993 56 25 24.0 3.0 14.3 8.4 6.8 EXHIBIT 3 (Continued) 1994 55 22 25.5 2.6 11.6 7.2 6.0 1995 51 31 24.9 2.6 10.8 7.0 6.1 (Present) 1996 Industry Average 1993-1996* 41 50 68 18 25 32 28 26 24 4.2 3.1 1.2 27.3 19.5 7.8 11.8. 8.7 3.4 9.9 7.2 3.1 *The three numbers for each ratio are computed in the following way. Ratios for all firms in the industry are arranged in what is considered a strongest-to-weakest order. The middle number represents the median ratio; that is, half the firms in the industry had ratios better than the median ratio and half had ratios that were worse. The top number represents the upper quartile figure, meaning 25 percent of the firms had ratios better than this. The lower number represents the lowest quartile, that is, 25 percent of the firms had ratios worse than this. **This shows the average length of time that trade debt is outstanding. Also called the average payment period. Calculated as A/P + (CGS/360). ***Calculated as (EBIT + Dep)/Sales. 1. Calculate the firm's 1996 ratios listed in Exhibit 3. 2. Part of Hamilton's evaluation will consist of comparing the firm's ratios to the industry numbers shown in Exhibit 3. (a) Discuss the limitations of such a comparative financial analysis. (b) In view of these limitations, why are such industry comparisons so frequently made? 3. Hamilton thinks that the profitability of the firm to the owners has been hurt by White's reluctance to use much interest-bearing debt. Is this a reasonable position? Explain. 4. The case mentions that White rarely takes trade discounts, which are typically 1/10, net 30. Does this seem like a wise financial move? Explain. 5. Calculate the company's market-to-book (MV/BV) ratio. (There are 5,000 shares of common stock.) 6. Hamilton's position is that White has not competently managed the firm. Defend this position using your previous answers and other information in the case. 38 PART II FINANCIAL ANALYSIS 7. White's position is that he has effectively managed the firm. Defend this position using your previous answers and other information in the case. 8. Play the role of an arbitrator. Is it possible based on an examination of the firm's ratios and other information in the case to assess White's managerial competence? Defend your position. 9. (a) Are the ratios you calculated based on market or book values? Explain. (b) Would you prefer ratios based on market or book values? Explain. Sales Cost of goods Gross margin Administrative Depreciation EBIT Interest EBT Taxes Net income EXHIBIT 1 Holly Fashions' Income Statements: 1993-1996 (000s) 1993 1995 $985.0 748.6 236.4 169.4 10.8 56.1 7.0 49.1 19.7 $29.5 1994 $1,040.0 774.8 265.2 202.8 11.4 51.0 6.0 45.0 18.0 $27.0 $1,236.0 928.2 307.8 236.1 13.6 58.1 5.0 53.1 21.2 $31.9 1996 $1,305.0 978.8 326.3 249.3 14.4 62.6 4.0 58.6 23.5 $35.2 ASSETS Cash EXHIBIT 2 Balance Sheets of the Holly Fashions Company: 1993-1996 (000s) 1993 Receivables Inventory Other current Current assets Gross fixed $40.4 153.2 117.0 5.9 316.5 44.8 Accumulated depreciation (12.0) Net fixed 32.8 Total assets $349.3 1994 $51.9 158.9 121.1 6.2 338.0 58.9 (23.4) 35.5 $373.5 1995 $38.6 175.1 193.4 7.4 414.5 78.1 (37.0) 41.1 $455.5 1996 $10.6 224.8 191.9 7.8 435.1 96.4 (51.4) 45.0 $480.1 (continued) LIABILITIES & NET WORTH Accounts payable Debt due Accruals Current liabilities Long-term debt Common stock Retained earnings Total L&NW EXHIBIT 2 (Continued) 1993 $53.8 10.0 19.7 83.5 60.0 150.0 55.8 $349.3 CASE 6 HOLLY FASHIONS 1994 $54.7 10.0 26.0 90.7 50.0 150.0 82.8 $373.5 1995 $86.2 10.0 24.7 120.9 40.0 180.0 114.6 $455.5 1996 $84.2 10.0 26.1 120.3 30.0 180.0 149.8 $480.1 39 EXHIBIT 3 Financial Ratios for the Holly Fashions Company: 1993-1996 Liquidity Ratios Current Quick Leverage Ratios Debt(%) Times interest earned Activity Ratios Inventory Turnover (CGS) Fixed Asset Turnover Total Asset Turnover 1993 3.8 2.4 41.1 8.0 6.4 30.0 2.8 1994 3.7 2.4 37.7 8.5 6.4 29.3 2.8 1995 3.4 1.8 35.3 11.6 4.8 30.1 2.7 (Present) 1996 Industry Average 1993-1996* 2.6 1.7 1.3 1.6 .8 .6 41 57 71 7.4 3.9 1.3. 8.1 6.0 3.5 40 25 12 3.5 2.8 2.0 (continued) 40 PART II FINANCIAL ANALYSIS Average Collection Period Days Purchases Outstanding** Profitability Ratios Gross Margin (%) Net Profit Margin (%) Return on Equity (%) Return on Total Assets (%) Operating Margin*** (%) 1993 56 25 24.0 3.0 14.3 8.4 6.8 EXHIBIT 3 (Continued) 1994 55 22 25.5 2.6 11.6 7.2 6.0 1995 51 31 24.9 2.6 10.8 7.0 6.1 (Present) 1996 Industry Average 1993-1996* 41 50 68 18 25 32 28 26 24 4.2 3.1 1.2 27.3 19.5 7.8 11.8. 8.7 3.4 9.9 7.2 3.1 *The three numbers for each ratio are computed in the following way. Ratios for all firms in the industry are arranged in what is considered a strongest-to-weakest order. The middle number represents the median ratio; that is, half the firms in the industry had ratios better than the median ratio and half had ratios that were worse. The top number represents the upper quartile figure, meaning 25 percent of the firms had ratios better than this. The lower number represents the lowest quartile, that is, 25 percent of the firms had ratios worse than this. **This shows the average length of time that trade debt is outstanding. Also called the average payment period. Calculated as A/P + (CGS/360). ***Calculated as (EBIT + Dep)/Sales.
Expert Answer:

Related Book For 

Income Tax Fundamentals 2013
ISBN: 9781285586618
31st Edition
Authors: Gerald E. Whittenburg, Martha Altus Buller, Steven L Gill
Posted Date:
Students also viewed these general management questions
-
A company XYZ in the United States is profitable and pays taxes. XYZ produces "widgets", and in recent years, the cost of producing each widget has been rising because the cost of raw materials (that...
-
IV. Asymmetric Riccati Equation (ARE): Let T TA-AT=A-TAT (nonlinear) a) Prove: Given the partitioned NxN matrix P= b) Let T satisfy ARE. Given the partitioned NxN matrix I 0 = A= [41 42 A2 A22....
-
1. Using the data in Exhibits C2.1 and C2.2, calculate and analyze the firm's 2012 and 2013 ratios. 2. Part of Owen's evaluation will consist of comparing the firm's ratios to the industry as shown...
-
Desgin a class diagram for Blackboard System. The diagram should also include: Generalization Relationships Association Relationships Aggregation/Composition Relationships Multiplicity please draw 1...
-
An excited hydrogen atom could, in principle, have a radius of 1.00mm. What would be the value of n for a Bohr orbit of this size? What would its energy be?
-
Manufacturing overhead was estimated to be $ 3 5 6 , 4 0 0 for the year along with 2 9 , 7 0 0 direct labor hours. Actual manufacturing overhead was $ 5 5 6 , 8 7 5 and actual direct labor hours were...
-
Describe the importance of a multidisciplinary approach to patient care.
-
In 2011, Alliant Corporation acquired Centerpoint Inc. for $300 million, of which $50 million was allocated to goodwill . At the end of 2013, management has provided the following information for a...
-
Here is the link for data using in it :https://drive.google.com/drive/folders/1XCCzbwh8bxsWuiJI9LTVQnUPLMfXqQWj?usp=drive_link How do I get the system mass, spring ,damping, setting time the correct...
-
Using dimensional equations, convert (a) 2 wk to microseconds. (b) 38.1 ft/s to kilometers/h. (c) 554 m 4 / (day kg) to ft 4 / (min lbm).
-
Danone has a new Light & Free healthy yogurt. On the one end of Danone's yogurt portfolio is protein-packed Oikos; on the other is probiotic-packed Activia. While the yogurts differ in ingredients,...
-
If a company uses a non-GAAP financial measure in an SEC filing, then the company must: A. give more prominence to the non-GAAP measure if it is used in earnings releases. B. provide a reconciliation...
-
Nutmeg Inc. uses the LIFO method to account for inventory. During years in which inventory unit costs are generally rising and in which the company purchases more inventory than it sells to...
-
Which of the following situations will most likely motivate managers to inflate earnings in the current period? A. Possibility of bond covenant violation B. Earnings in excess of analysts forecasts...
-
Which of the following is most likely a lessees disclosure about operating leases? A. Lease liabilities. B. Future obligations by maturity. C. Net carrying amounts of leased assets.
-
Which of the following is most likely to reflect conservative accounting choices? A. Decreased reported earnings in later periods B. Increased reported earnings in the current period C. Increased...
-
Over the last two years, the unemployment rate in Westerlight has risen from 4% to 8%, while GDP growth has been 1.5%. Milo, a citizen of Westerlight, currently doesnt have a job and although he is...
-
Represent each of the following combination of units in the correct SI form using an appropriate prefix: (a) m/ms, (b) k m, (c) k s /mg, and (d) k m N.
-
Mary paid $2,000 of state income taxes in 2012. The total sales tax she paid during 2012 was $5,500, which included $3,000 for the cost of a new car. How should Mary treat the taxes paid on her 2012...
-
William sold Section 1245 property for $25,000 in 2012. The property cost $35,000 when it was purchased 5 years ago. The depreciation claimed on the property was $16,000. a. Calculate the adjusted...
-
Matthew borrows $250,000 to invest in bonds. During 2012, his interest on the loan is $30,000. Matthew's interest income from the bonds is $10,000. This is Matthew's only investment income. a....
-
Comment on this statement: Dynamic modeling is about interaction.
-
Explain how objects interact by exchanging messages.
-
Describe the relationship between dynamic modeling, behavioral modeling, and structural modeling.

Study smarter with the SolutionInn App