

Question: 1. Calculate the Pearson correlation between hand and foot size for students in the Student Data Table. Graph the relationship, determine a hypothesis to test
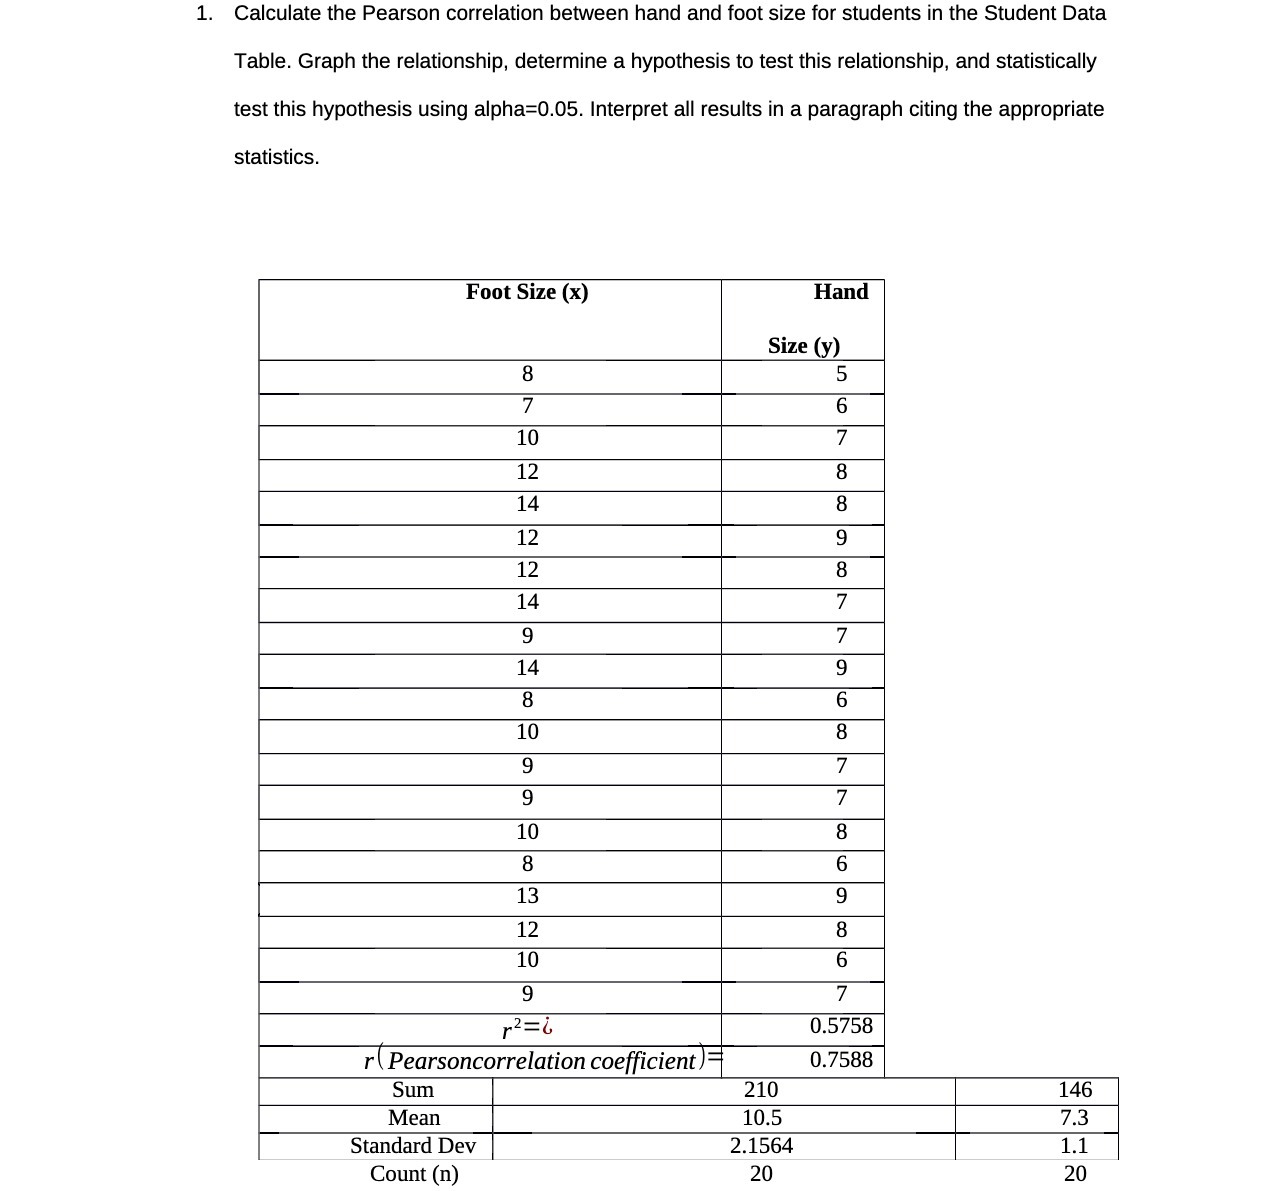
1. Calculate the Pearson correlation between hand and foot size for students in the Student Data Table. Graph the relationship, determine a hypothesis to test this relationship, and statistically test this hypothesis using alpha=0.05. Interpret all results in a paragraph citing the appropriate statistics. Foot Size (x) Hand Size (y) 8 6 10 J 12 8 14 8 12 12 14 9 14 8 10 10 8 13 12 10 6 9 7 12=i 0.5758 r( Pearsoncorrelation coefficient )= 0.7588 Sum 210 146 Mean 10.5 7.3 Standard Dev 2.1564 1.1 Count (n) 20 20
Step by Step Solution
There are 3 Steps involved in it
1 Expert Approved Answer
Step: 1 Unlock

Question Has Been Solved by an Expert!
Get step-by-step solutions from verified subject matter experts
Step: 2 Unlock
Step: 3 Unlock