

Question: 1. Calibration graph for 4-nitrophenol (the product) a. Plot the calibration graph using the data provided in the laboratory quide, and draw a line of
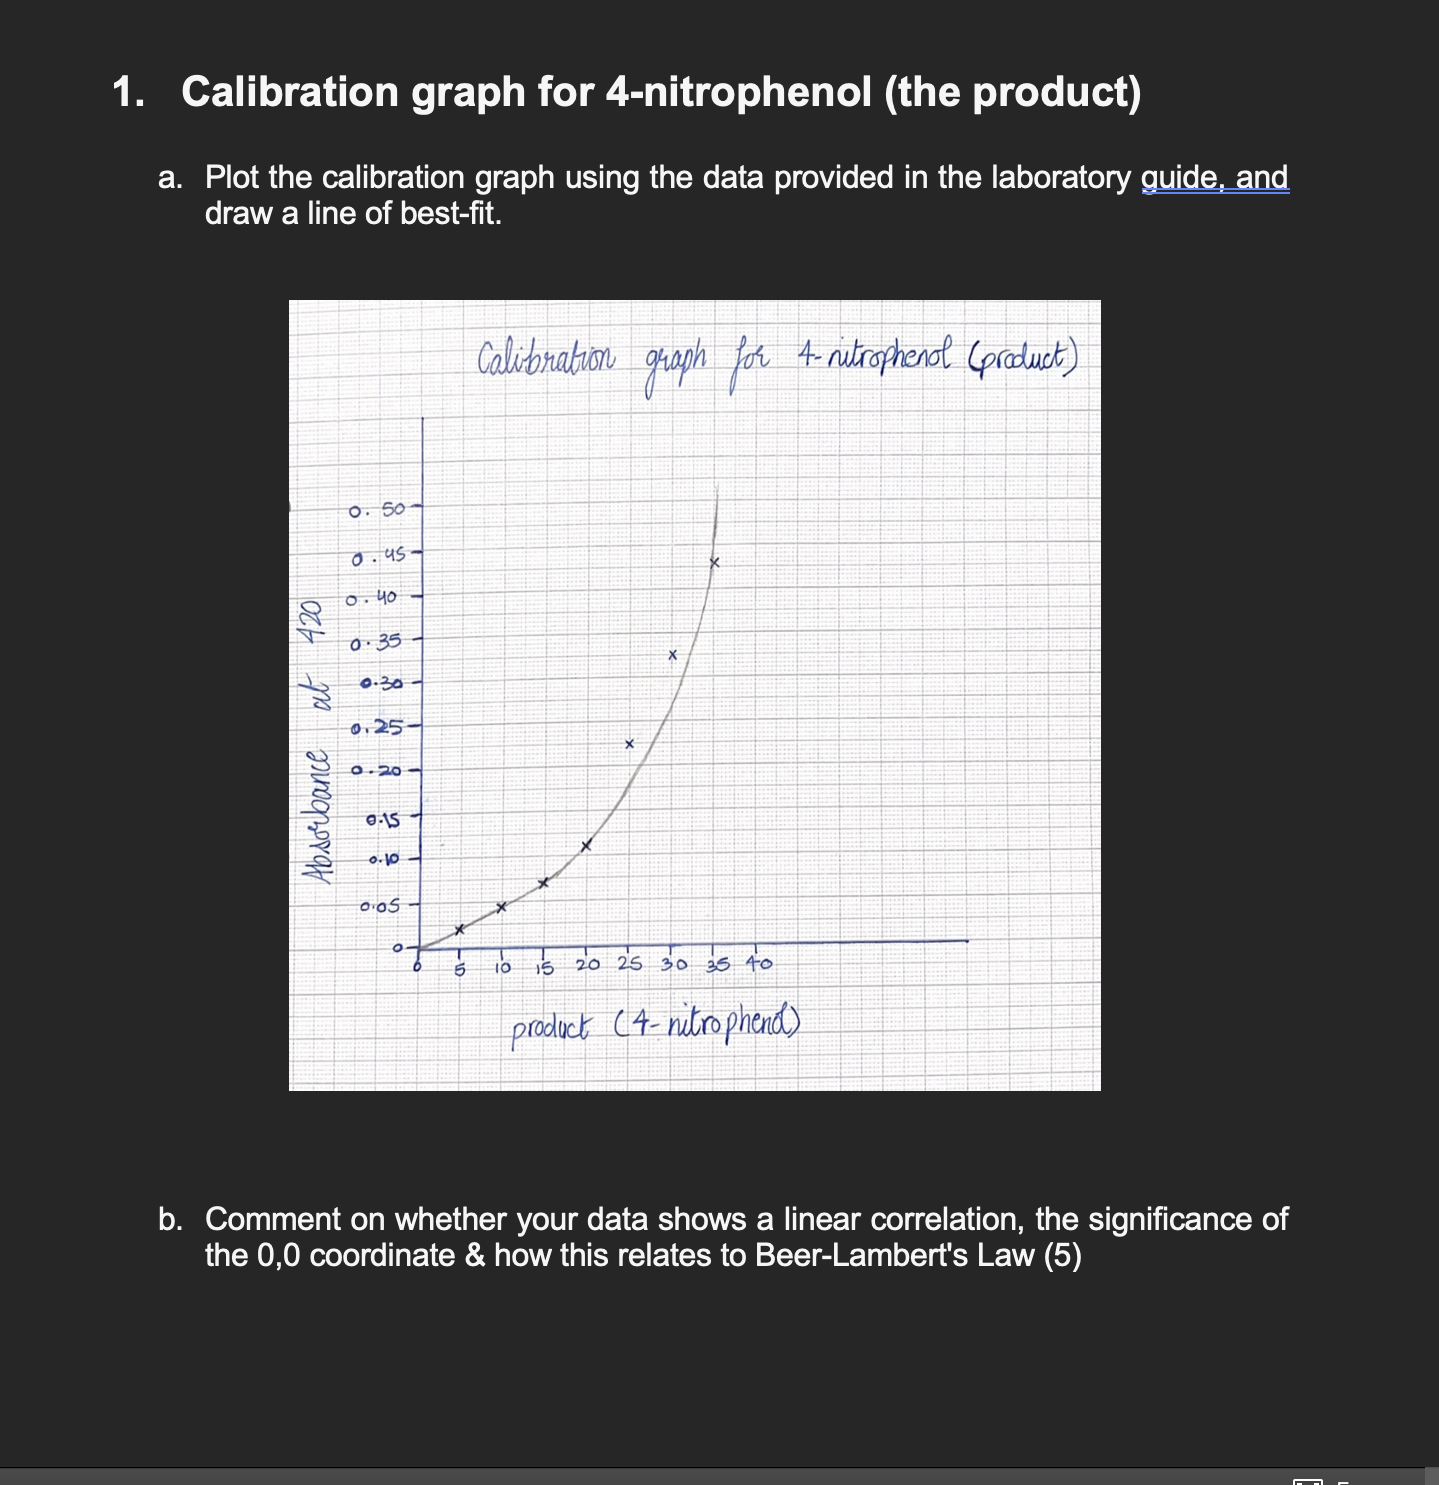
1. Calibration graph for 4-nitrophenol (the product) a. Plot the calibration graph using the data provided in the laboratory quide, and draw a line of best-fit. Calibration graph for 4- nitrophenol (product) 0 . 50 0. 45- O . 40 0 . 35 0.30 0. 25 0 - 20 Absorbance 0-15 0. 10 10 15 20 25 30 35 40 product ( 4 - nitrophend ) b. Comment on whether your data shows a linear correlation, the significance of the 0,0 coordinate & how this relates to Beer-Lambert's Law
Step by Step Solution
There are 3 Steps involved in it
1 Expert Approved Answer
Step: 1 Unlock

Question Has Been Solved by an Expert!
Get step-by-step solutions from verified subject matter experts
Step: 2 Unlock
Step: 3 Unlock