

Question: 1. Calibri (Body) v 11 AA do Wrap Text v General Insert v Ex Delete v Z Paste BIUV MvAv Merge & Center v $
1.
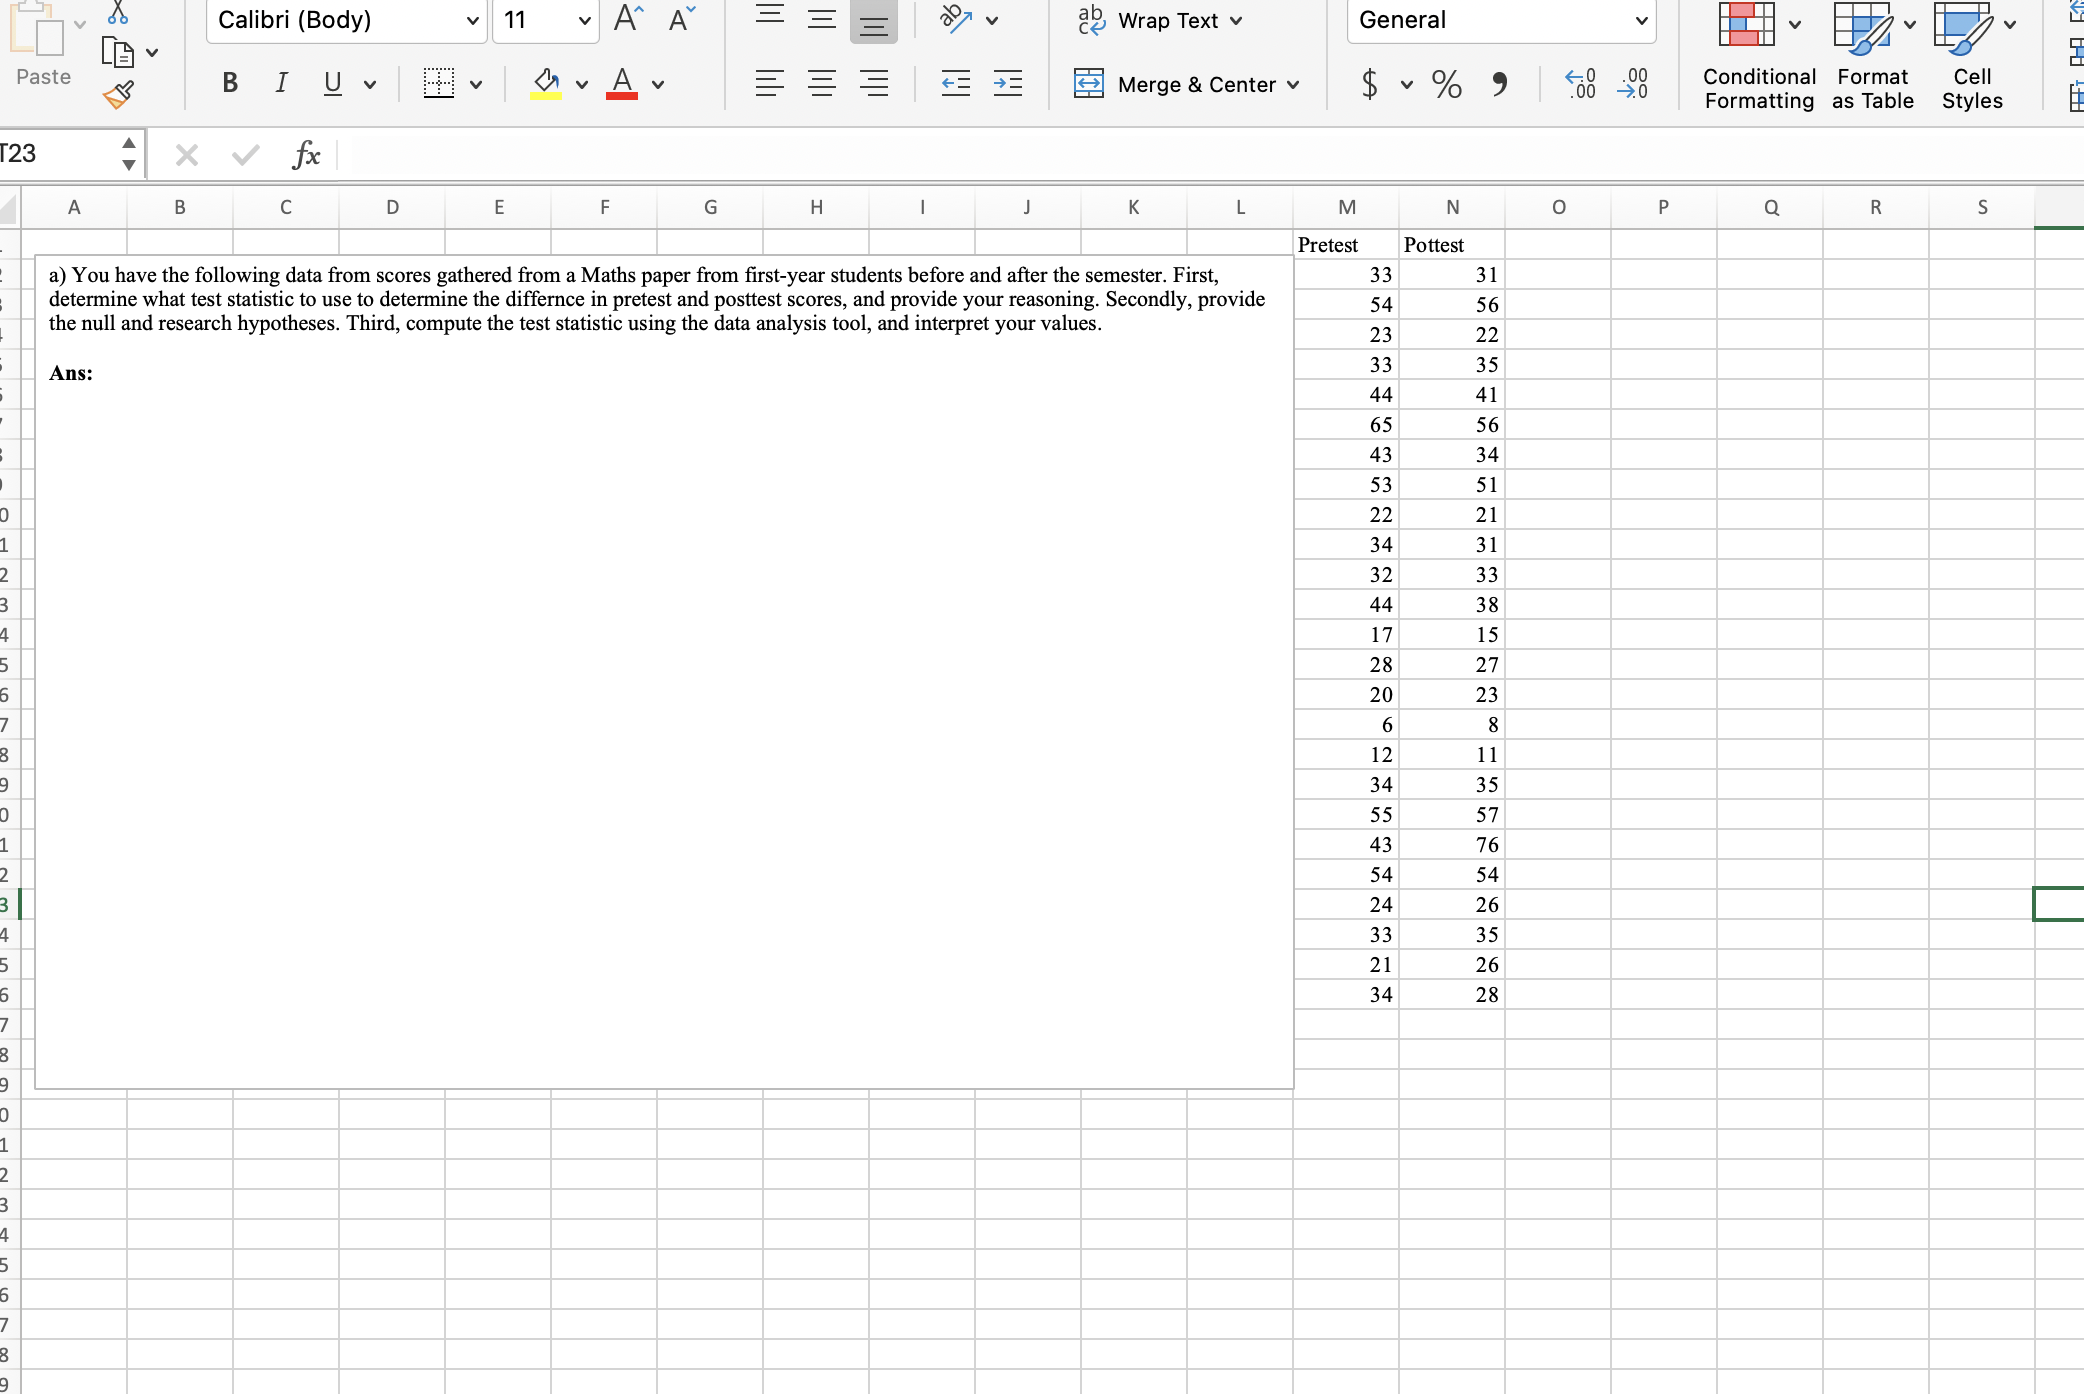
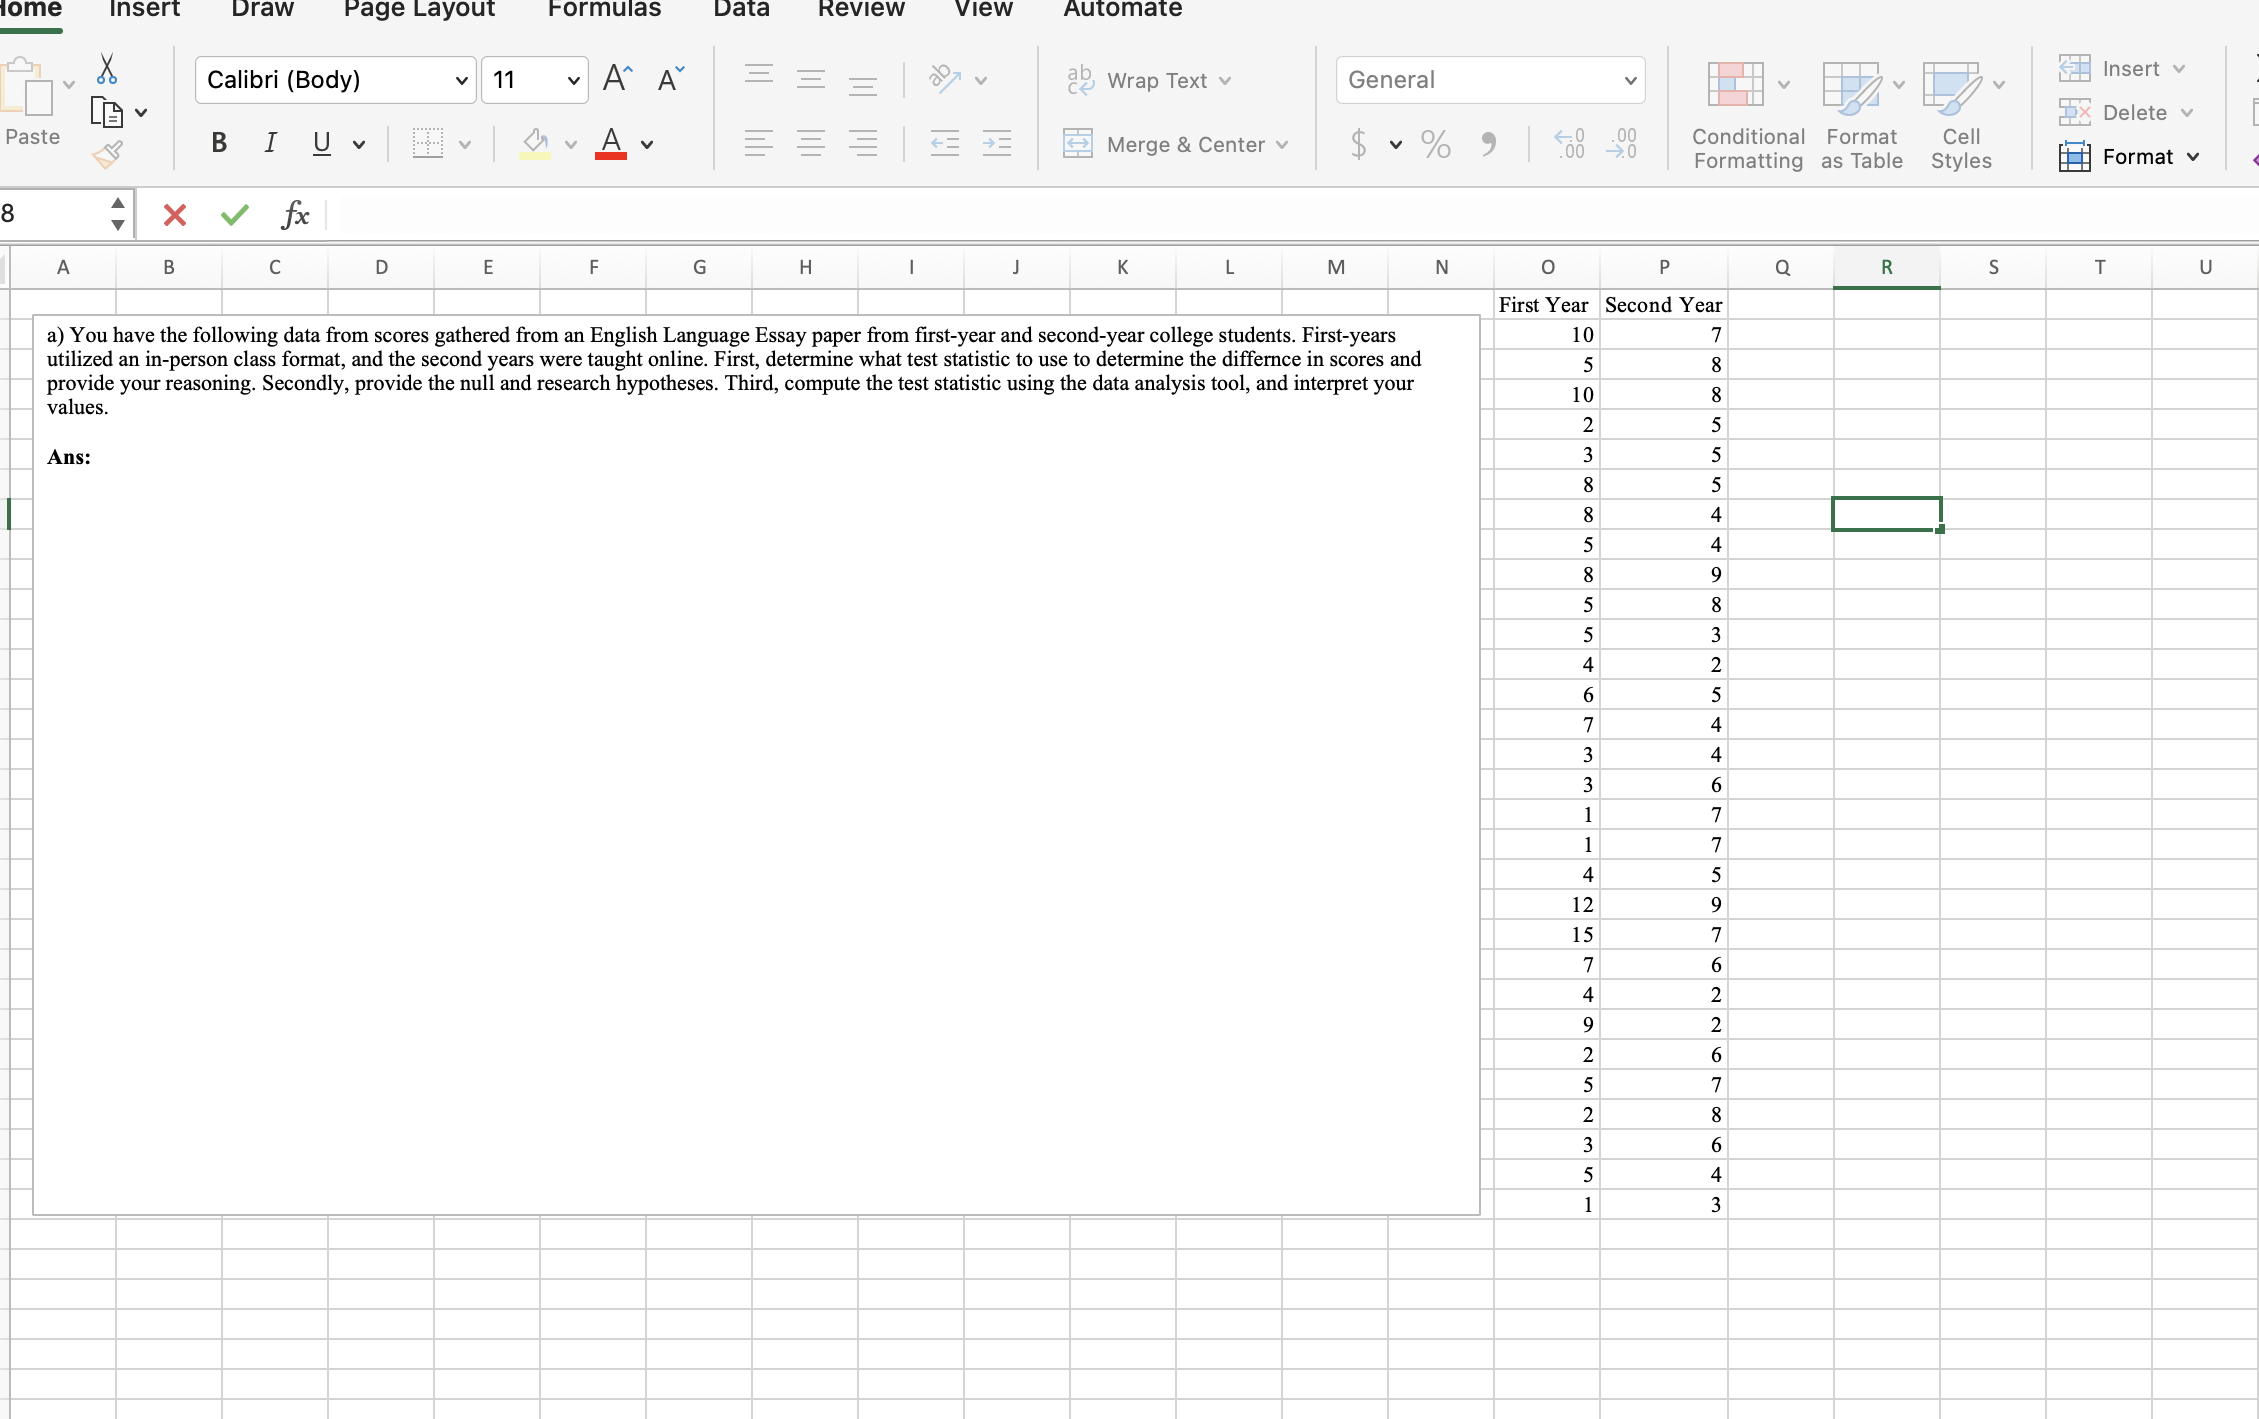
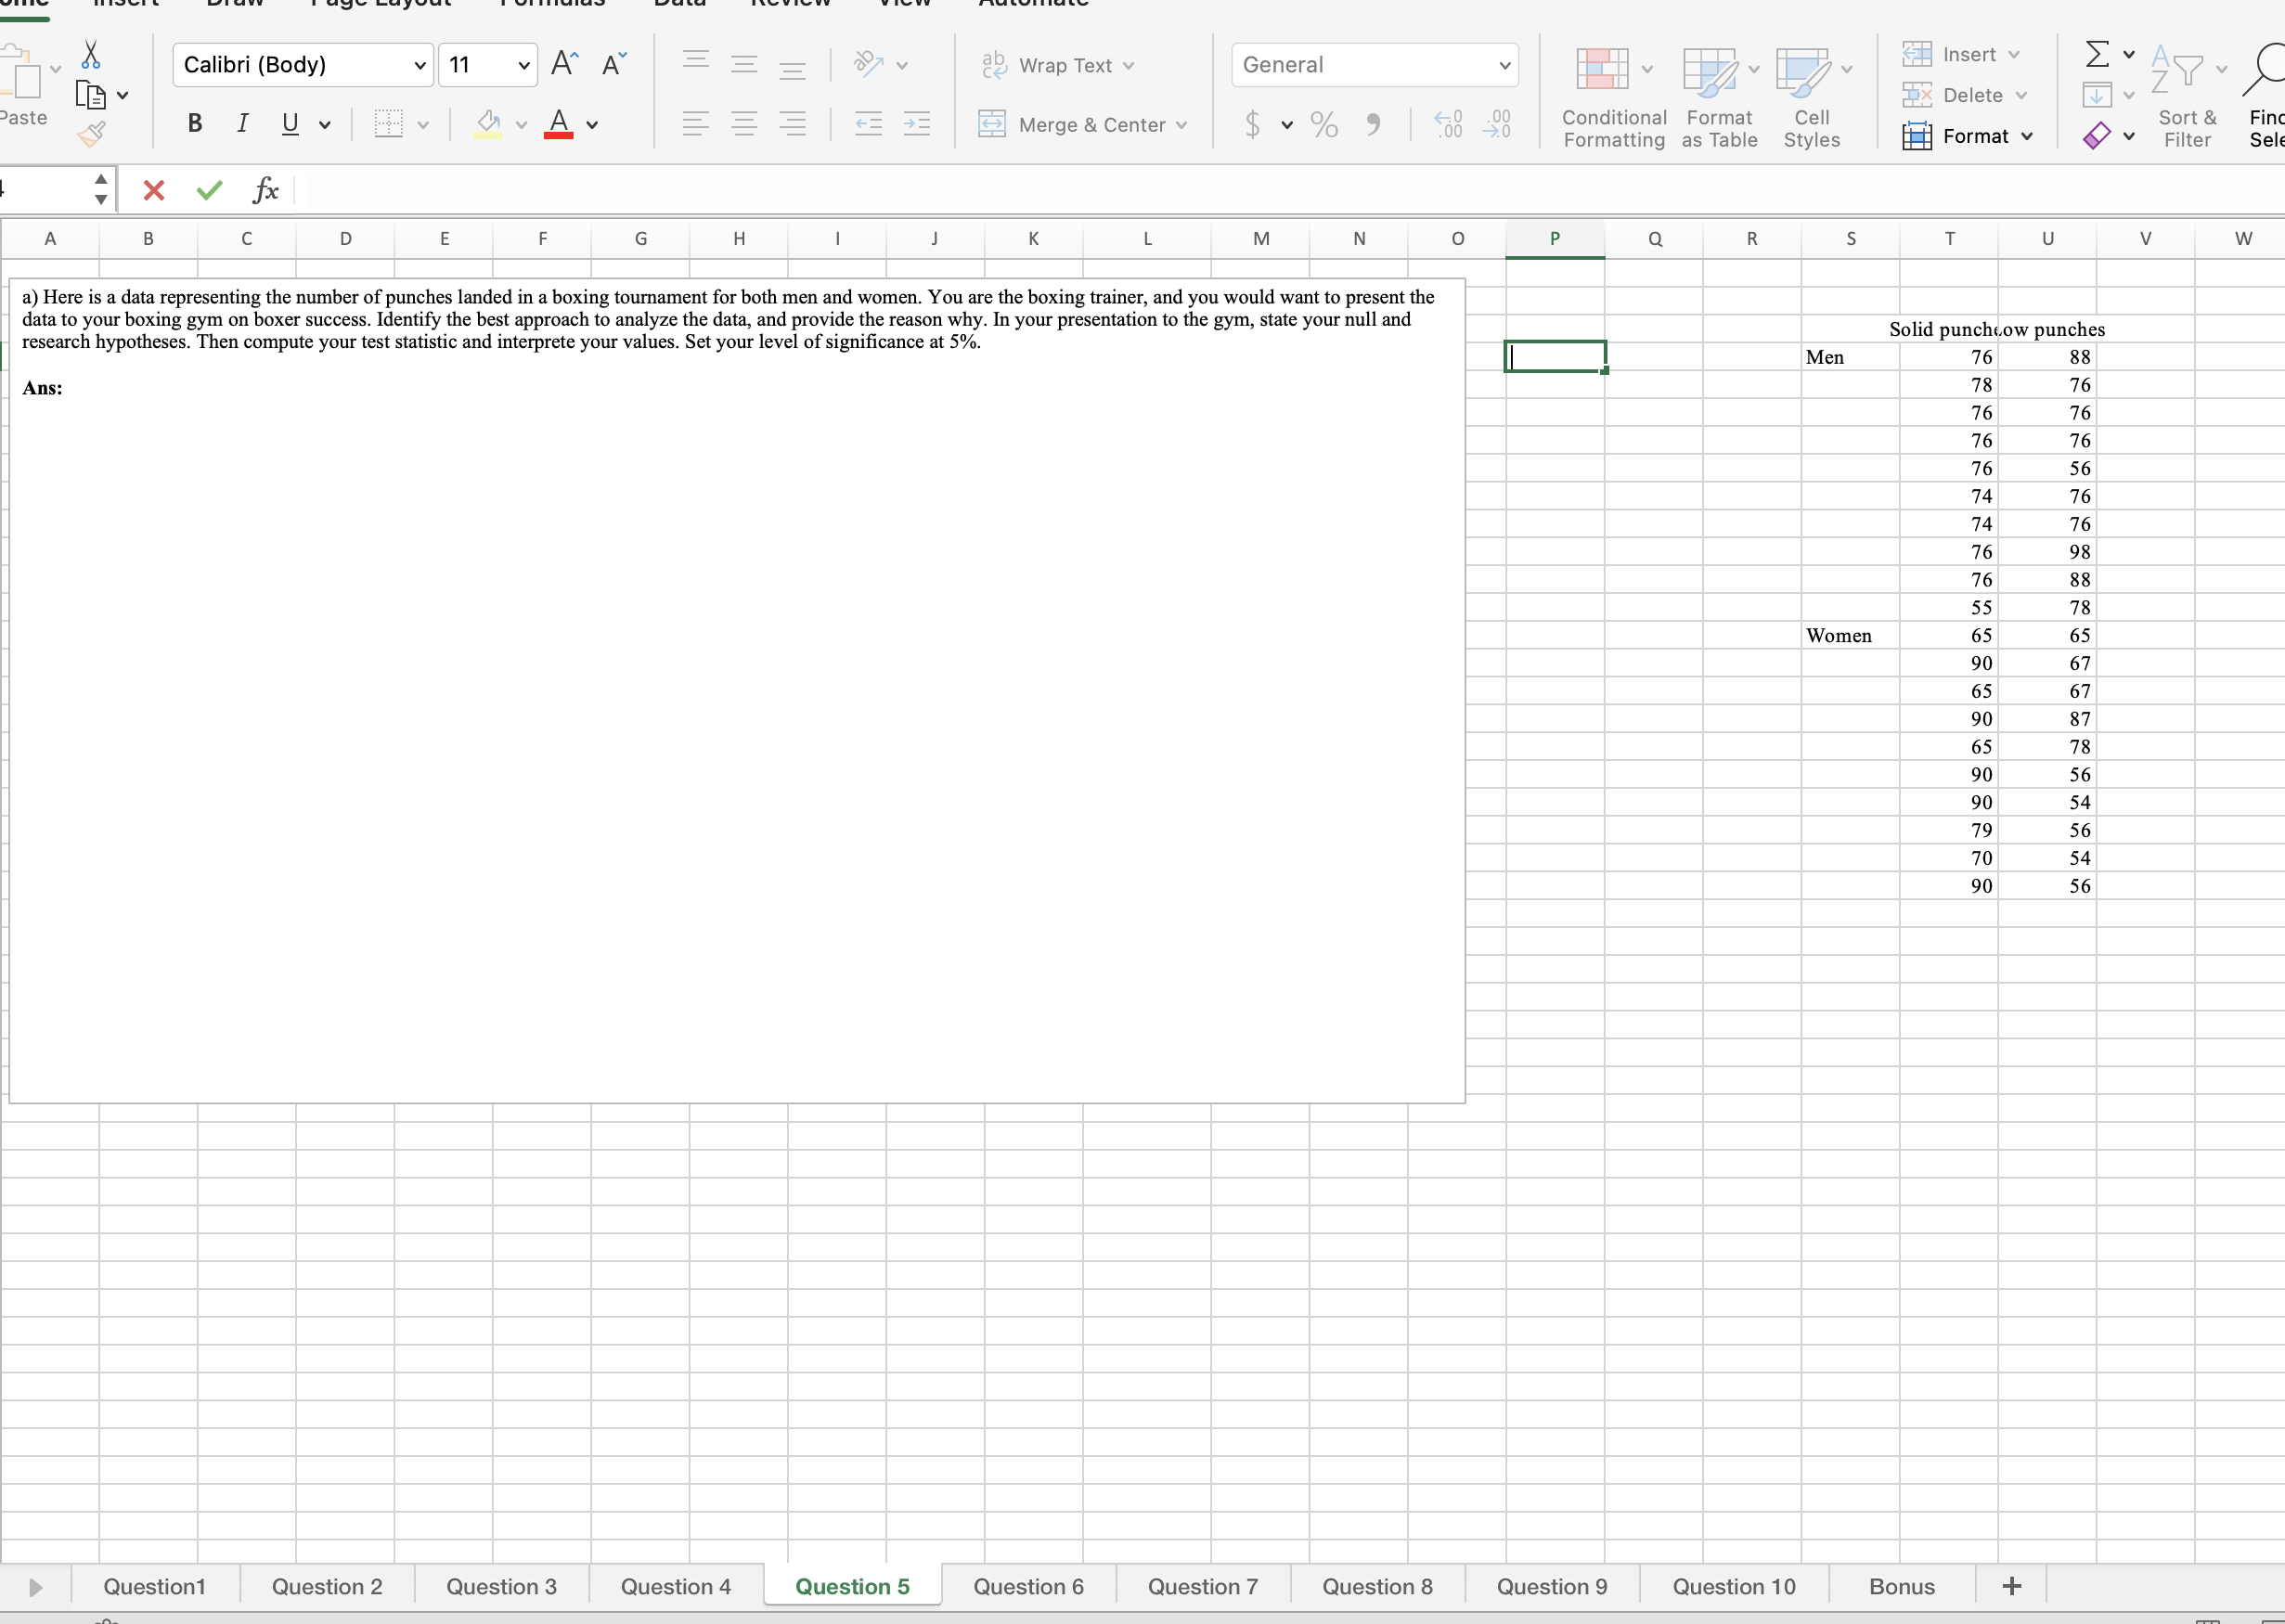
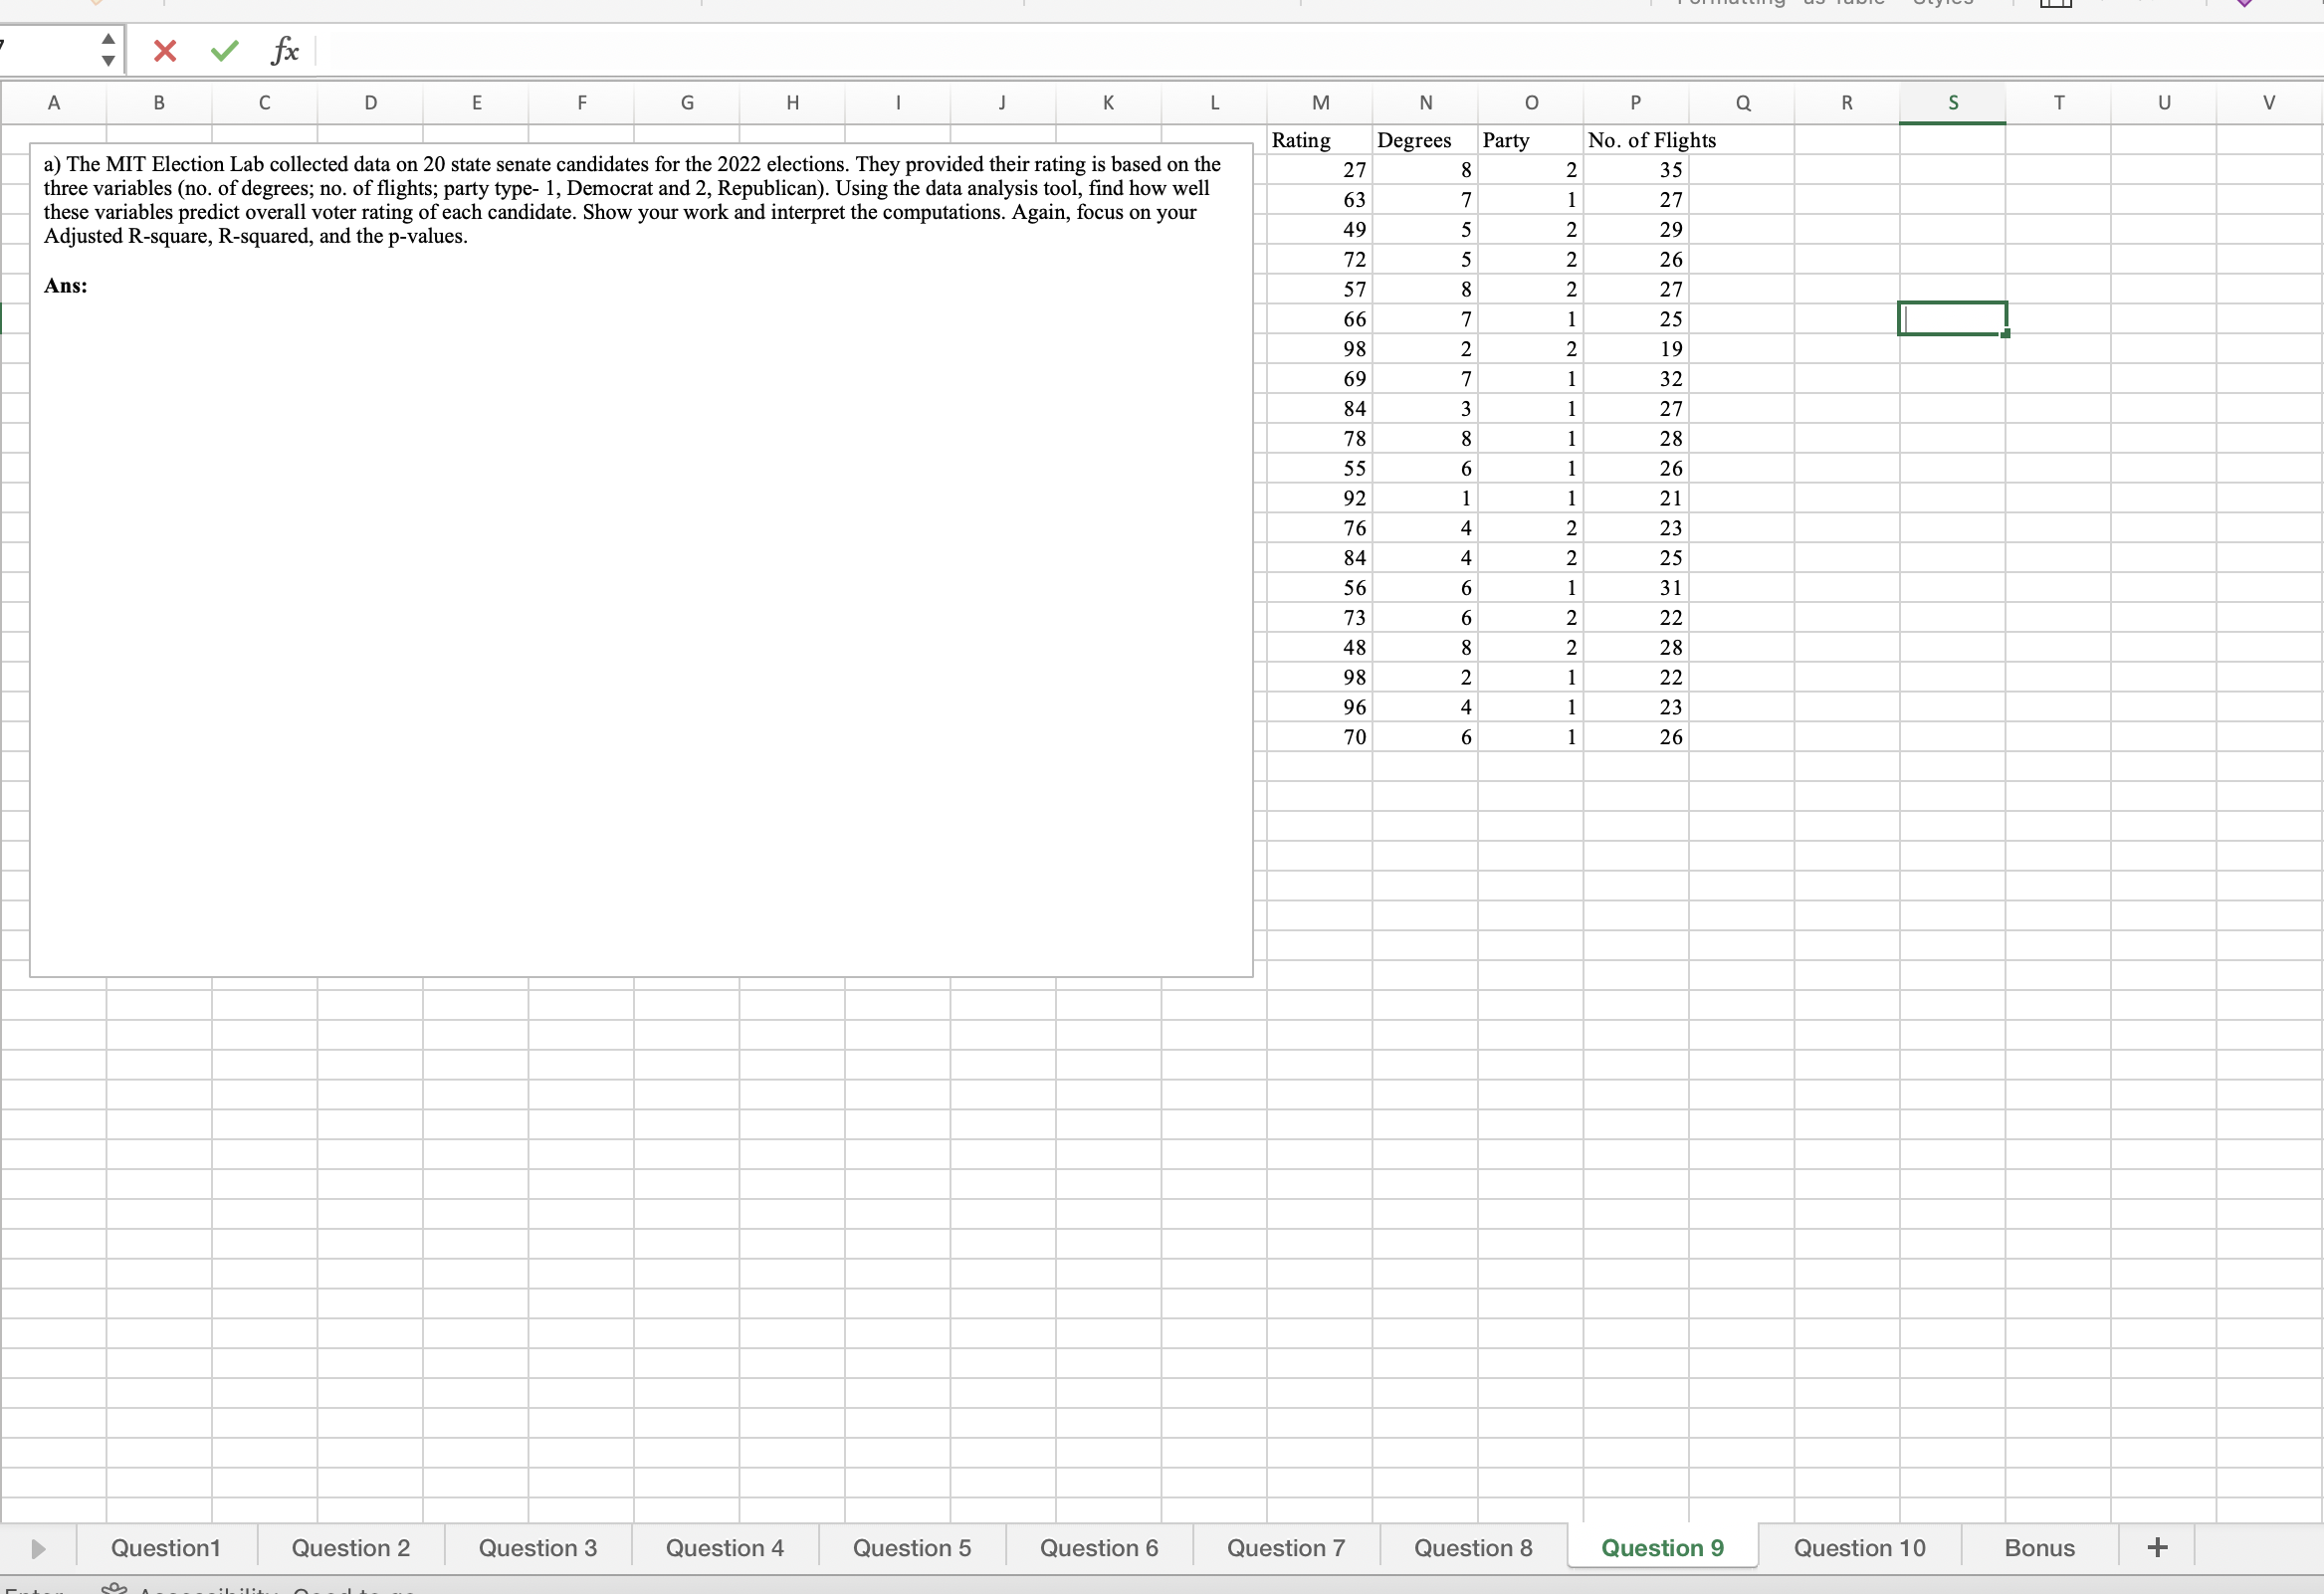
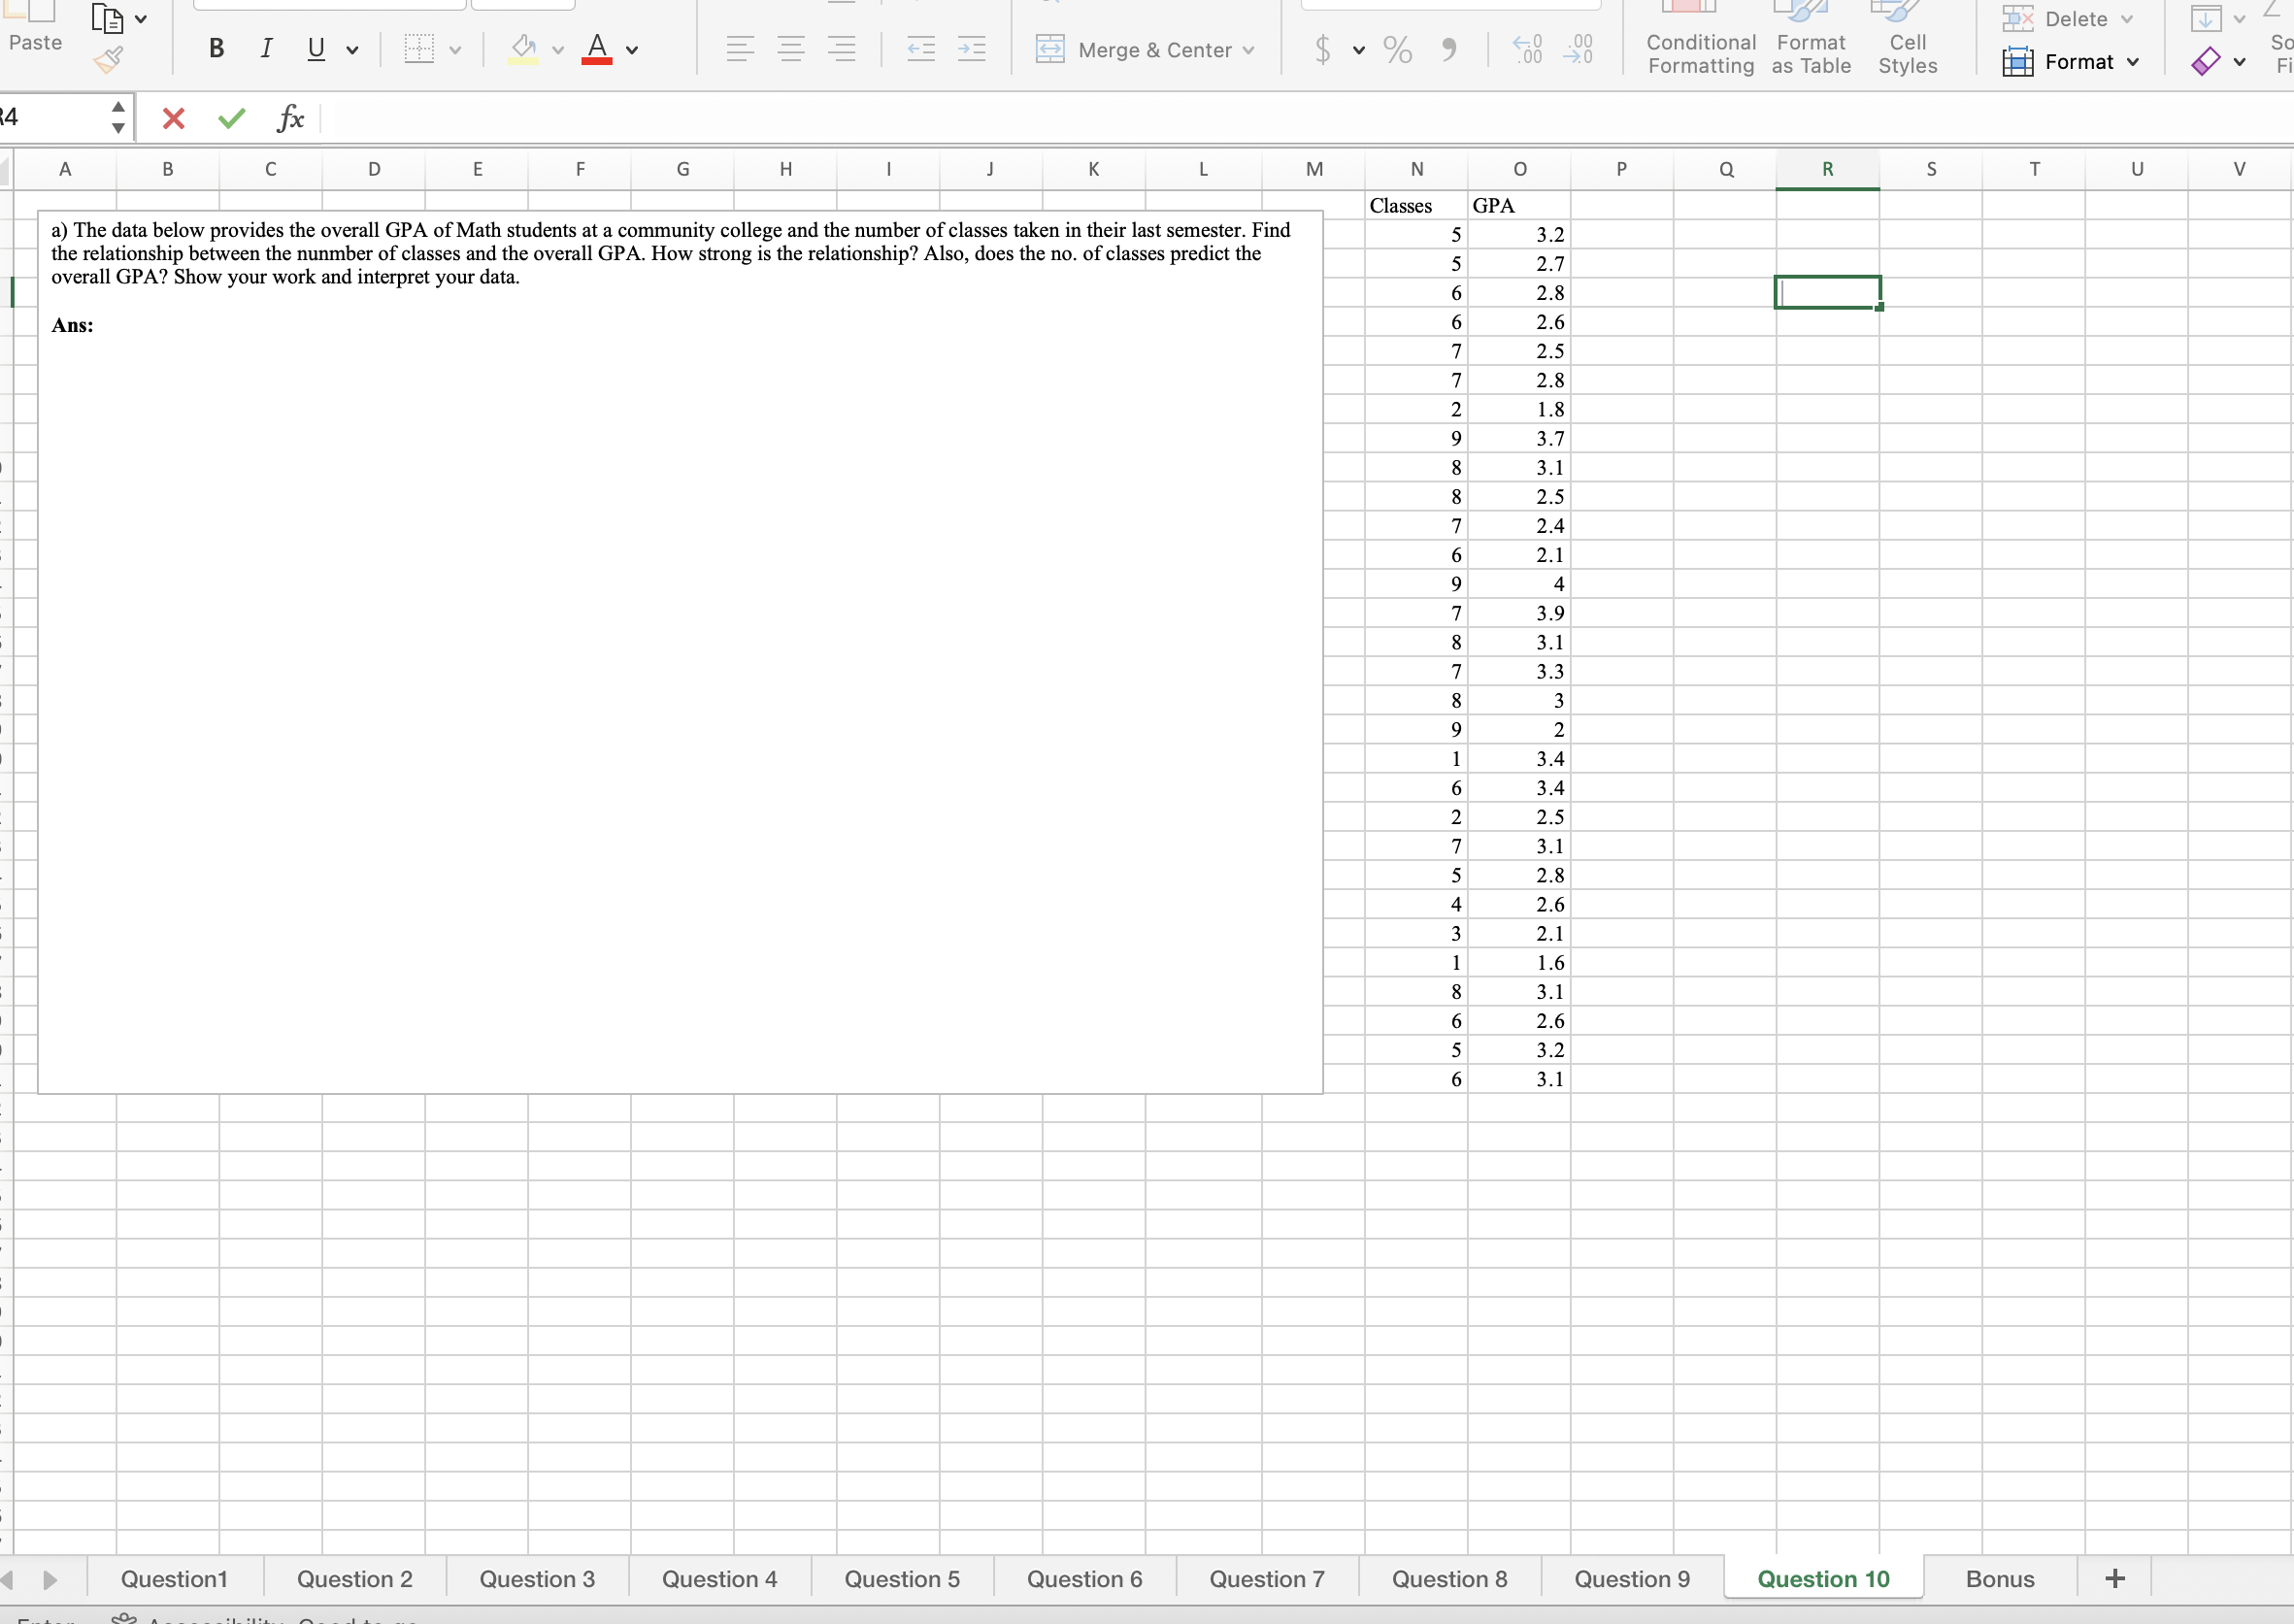
Calibri (Body) v 11 AA do Wrap Text v General Insert v Ex Delete v Z Paste BIUV MvAv Merge & Center v $ ~ % " -00 Conditional Format Cell Sor Formatting as Table Styles Format v Filt 14 X V fx A B C D E F G H I J K L M N 0 P Q R S T U V a) When is it appropriate to use the following tools and why? (at least a paragraph each): - Z-tests - T-tests for different groups - T-tests for related groups - Analysis of the variance - Regression analysis Ans:AA E de Wrap Text v General Calibri (Body) v 11 $ ~ % " Conditional Format Cell iv Merge & Center v 00 .00 MvAv Formatting as Table Style Paste BI UV D26 X V fx M N Q R G H K A B C D E a) Assume you are a consultant with Boston Consulting. You have been tasked with ascertaining the effect of diversity in the work place and how that influences innovation and profits. After gathering and analyzing the data, you realize there is a statistical significance between diversity and profits. However, there was no statistical significance between diversity and innovation. N You have been asked to present your findings to your superiors. First explain statistical significance and explain why it is important in the study of inferences. b) Explain the difference between meaningfulness and statistical significance c) In your research, you formulated the following research question: Diversity positively affects innovation in the workplace. -What does chance have to do with testing the above research hypothesis for significance? Ans: 10 11 12 13 14 15 16 17 18 19 20 21 22 23 24 25 26 27 28 29 30 31 32 33 34 35 36 37 38 39Calibri (Body) v 11 A A = = de Wrap Text v General Paste BI UV DVAv = E Merge & Center v $ ~ % 9 Conditional Format Cell Formatting as Table Styles 23 X V fx A B D E F G H K L M N O P Q R S Pretest Pottest a) You have the following data from scores gathered from a Maths paper from first-year students before and after the semester. First, 33 31 determine what test statistic to use to determine the differnce in pretest and posttest scores, and provide your reasoning. Secondly, provide 54 56 the null and research hypotheses. Third, compute the test statistic using the data analysis tool, and interpret your values. 23 22 Ans: 33 35 44 41 65 56 43 34 53 51 22 21 34 31 32 33 44 38 17 15 28 27 20 23 6 8 12 11 34 35 55 57 43 76 54 54 24 26 33 35 21 26 34 28ome Insert Draw Page Layout Formulas Data Review View Automate Calibri (Body) 11 A A de Wrap Text v General Insert v Ex Delete v Paste BIUV V VAv = Merge & Center v $ ~ % 9 00 .00 Conditional Format Cell Formatting as Table Styles Format v 8 X V fx A B D E F G H K M N O P Q R S T U First Year Second Year a) You have the following data from scores gathered from an English Language Essay paper from first-year and second-year college students. First-years 10 utilized an in-person class format, and the second years were taught online. First, determine what test statistic to use to determine the differnce in scores and provide your reasoning. Secondly, provide the null and research hypotheses. Third, compute the test statistic using the data analysis tool, and interpret your values. Ans: W A O OO N A N N a J D U J J a A A UI N W OO D A A UI UI UI OO OO J - U W N U N DA J U N A H H W W V O A VIVI DO UI DO DOWN OUTCalibri (Body) v 11 A A = 207 V do Wrap Text v General Insert v x Delete v aste BIUV Merge & Center $ ~ % 9 00 Conditional Format Cell Sort & Fin Formatting as Table Styles Format v Filter Sel X V fx A B D E G H M N P Q R S T U V W a) Here is a data representing the number of punches landed in a boxing tournament for both men and women. You are the boxing trainer, and you would want to present the data to your boxing gym on boxer success. Identify the best approach to analyze the data, and provide the reason why. In your presentation to the gym, state your null and research hypotheses. Then compute your test statistic and interprete your values. Set your level of significance at 5%. Solid punchcow punches Men 76 88 Ans: 78 76 76 76 76 76 76 56 74 76 74 76 76 98 76 88 55 78 Women 65 65 90 67 65 67 90 87 65 78 90 56 90 54 79 56 70 90 Question1 Question 2 Question 3 Question 4 Question 5 Question 6 Question 7 Question 8 Question 9 Question 10 Bonus +v & Calibri (Body) n o vA A === Wrap Text General
Step by Step Solution
There are 3 Steps involved in it

Get step-by-step solutions from verified subject matter experts