

Question: 1. Can we use the dividend discount model to value Precision Cast Part Corp before Berkshire Hathaway acquire it with $235 per share ? Why
1. Can we use the dividend discount model to value Precision Cast Part Corp before Berkshire Hathaway acquire it with $235 per share ? Why or why not?
2.Based on the multiples for comparable regulated utilities using the table below, what is the range of possible values for Precision Cast Part Corp ?
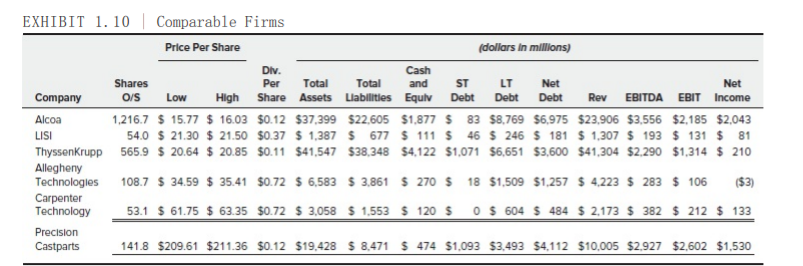
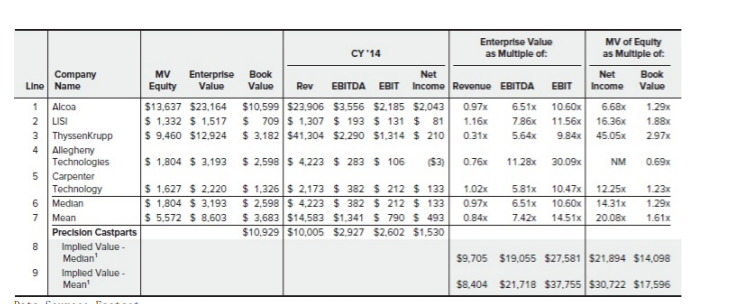
EXHIBIT 1.10 Comparable Firms Price Per Share (dollars in millions) Div. Cash Shares Per Total Total and ST LT Net Net Company O/S Low High Share Assets Liabilities Equlv Debt Debt Debt Rev EBITDA EBIT Income Alcoa 1,216.7 $ 15.77 $ 16.03 $0.12 $37,399 $22,605 $1,877 $ 83 $8,769 $6,975 $23,906 $3,556 $2,185 $2,043 54.0 $ 21.30 $ 21.50 $0.37 $ 1,387 $ 677 $ 111 $ 45 $ 246 $ 181 $ 1,307 $ 193 $ 131 $ 81 ThyssenKrupp 565.9 $ 20.64 $ 20.85 $0.11 $41,547 538,348 54,122 $1,071 $6,651 $3,600 $41,304 $2,290 $1,314 $ 210 Allegheny Technologies 108.7 $ 34.59 $ 35.41 $0.72 $ 6,583 $ 3.861 $ 270 $ 18 $1,509 $1,257 $ 4,223 $ 283 $ 106 ($3) Carpenter Technology 53.1 $ 61.75 $ 63.35 $0.72 $ 3,058 $ 1.553 $ 120 $0 $ 604 $ 484 $ 2.173 $ 382 $ 212 $ 133 Precision Castparts 141.8 $209.61 $211.36 $0.12 $19.428 $ 8.471 $ 474 $1.093 $3.493 $4.112 $10,005 $2.927 $2,602 $1.530 LISI WN Enterprise Value MV of Equity CY '14 as Multiple of: as Multiple of: Company MV Enterprise Book Net Net Book Line Name Equity Value Value Rev EBITDA EBIT Income Revenue EBITDA EBIT Income Value 1 Alcoa $13,637 $23,164 $10,599 $23,906 $3,556 $2,185 $2,043 0.97x 6.51x 10.60% 6.68% 1.29% LISI $ 1,332 $ 1.517 $ 709 $ 1,307 $ 193 $ 131 $ 81 1.16x 7.86 11.56x 16.36x 1.88x 3 ThyssenKrupp $ 9,460 $12,924 $ 3,182 $41,304 $2.290 $1,314 $ 210 0.31x 5.64x 9.84x 45.05% 2.97x 4 Allegheny Technologies $ 1.804 $ 3,193 $ 2,598 $ 4.223 $ 283 $ 106 (53) 0.76x 11.28x 30.09x NM 0.69x 5 Carpenter Technology S 1.627 $ 2.220 $ 1,326 $ 2,173 $ 382 $ 212 $ 133 1.02x 5.81x 10.47x 12.25 1.23x 6 Median $ 1.804 $ 3.193 $ 2,598 $ 4,223 $ 382 $ 212 $ 133 0.97 6.51x 10.60 14.31x 1.29% 7 Mean $ 5,572 $ 8,603 $ 3,683 $14,583 $1,341 $ 790 $ 493 0.84x 7.42x 14.51x 20.08x 1.61x Precision Castparts $10,929 $10,005 $2.927 $2,602 $1,530 8 Implied Value Median $9.705 $19,055 $27,581 $21,894 $14,098 9 Implied Value - Mean! $8.404 $21,718 $37,755 $30.722 $17.596 EXHIBIT 1.10 Comparable Firms Price Per Share (dollars in millions) Div. Cash Shares Per Total Total and ST LT Net Net Company O/S Low High Share Assets Liabilities Equlv Debt Debt Debt Rev EBITDA EBIT Income Alcoa 1,216.7 $ 15.77 $ 16.03 $0.12 $37,399 $22,605 $1,877 $ 83 $8,769 $6,975 $23,906 $3,556 $2,185 $2,043 54.0 $ 21.30 $ 21.50 $0.37 $ 1,387 $ 677 $ 111 $ 45 $ 246 $ 181 $ 1,307 $ 193 $ 131 $ 81 ThyssenKrupp 565.9 $ 20.64 $ 20.85 $0.11 $41,547 538,348 54,122 $1,071 $6,651 $3,600 $41,304 $2,290 $1,314 $ 210 Allegheny Technologies 108.7 $ 34.59 $ 35.41 $0.72 $ 6,583 $ 3.861 $ 270 $ 18 $1,509 $1,257 $ 4,223 $ 283 $ 106 ($3) Carpenter Technology 53.1 $ 61.75 $ 63.35 $0.72 $ 3,058 $ 1.553 $ 120 $0 $ 604 $ 484 $ 2.173 $ 382 $ 212 $ 133 Precision Castparts 141.8 $209.61 $211.36 $0.12 $19.428 $ 8.471 $ 474 $1.093 $3.493 $4.112 $10,005 $2.927 $2,602 $1.530 LISI WN Enterprise Value MV of Equity CY '14 as Multiple of: as Multiple of: Company MV Enterprise Book Net Net Book Line Name Equity Value Value Rev EBITDA EBIT Income Revenue EBITDA EBIT Income Value 1 Alcoa $13,637 $23,164 $10,599 $23,906 $3,556 $2,185 $2,043 0.97x 6.51x 10.60% 6.68% 1.29% LISI $ 1,332 $ 1.517 $ 709 $ 1,307 $ 193 $ 131 $ 81 1.16x 7.86 11.56x 16.36x 1.88x 3 ThyssenKrupp $ 9,460 $12,924 $ 3,182 $41,304 $2.290 $1,314 $ 210 0.31x 5.64x 9.84x 45.05% 2.97x 4 Allegheny Technologies $ 1.804 $ 3,193 $ 2,598 $ 4.223 $ 283 $ 106 (53) 0.76x 11.28x 30.09x NM 0.69x 5 Carpenter Technology S 1.627 $ 2.220 $ 1,326 $ 2,173 $ 382 $ 212 $ 133 1.02x 5.81x 10.47x 12.25 1.23x 6 Median $ 1.804 $ 3.193 $ 2,598 $ 4,223 $ 382 $ 212 $ 133 0.97 6.51x 10.60 14.31x 1.29% 7 Mean $ 5,572 $ 8,603 $ 3,683 $14,583 $1,341 $ 790 $ 493 0.84x 7.42x 14.51x 20.08x 1.61x Precision Castparts $10,929 $10,005 $2.927 $2,602 $1,530 8 Implied Value Median $9.705 $19,055 $27,581 $21,894 $14,098 9 Implied Value - Mean! $8.404 $21,718 $37,755 $30.722 $17.596
Step by Step Solution
There are 3 Steps involved in it

Get step-by-step solutions from verified subject matter experts