

Question: 1 Chapter 28 1.1 1.5 Use these two graphs to answer the following questions NOBY.G145 5123 12.3 178 FAM COP Inflation iparcent per year 635

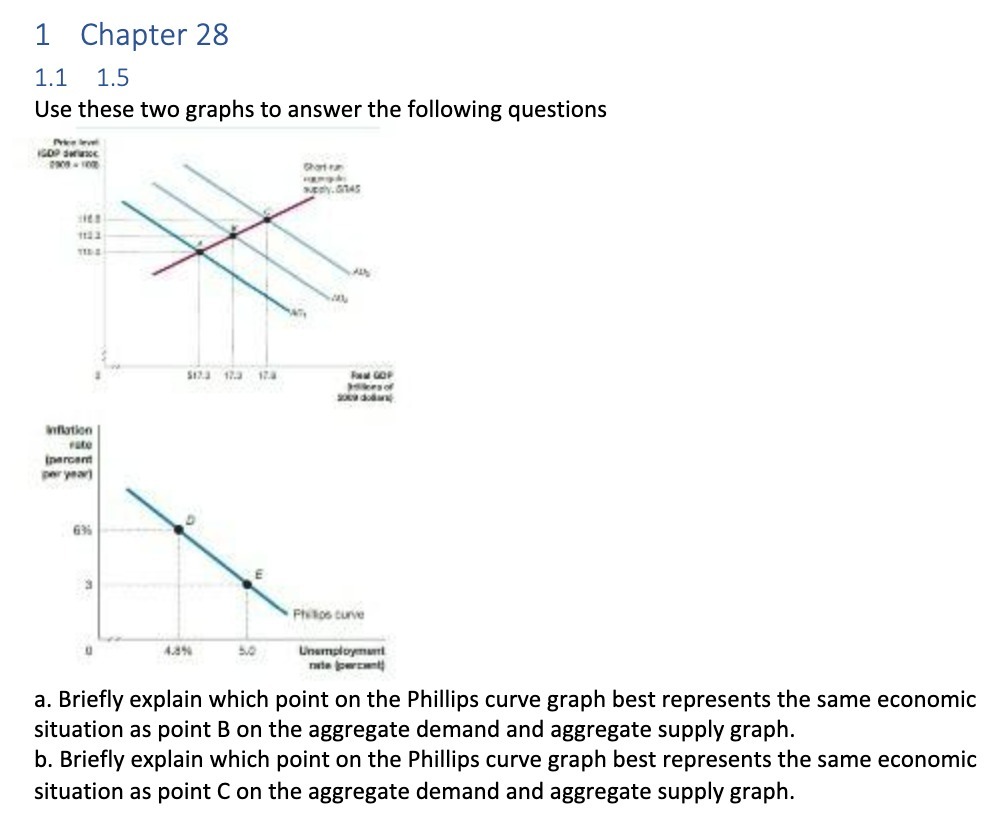
1 Chapter 28 1.1 1.5 Use these two graphs to answer the following questions NOBY.G145 5123 12.3 178 FAM COP Inflation iparcent per year 635 Filllos curve 5.0 Unemployment a. Briefly explain which point on the Phillips curve graph best represents the same economic situation as point B on the aggregate demand and aggregate supply graph. b. Briefly explain which point on the Phillips curve graph best represents the same economic situation as point C on the aggregate demand and aggregate supply graph
Step by Step Solution
There are 3 Steps involved in it
1 Expert Approved Answer
Step: 1 Unlock

Question Has Been Solved by an Expert!
Get step-by-step solutions from verified subject matter experts
Step: 2 Unlock
Step: 3 Unlock