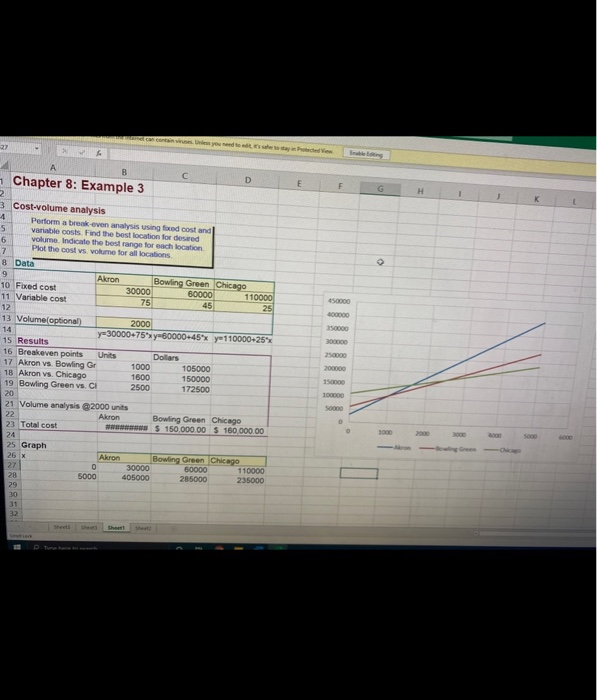
Question: 1 Chapter 8: Example 3 G H 3 Cost-volume analysis -4 Perform a break even analysis using foxed cost and 5 variable costs. Find the

1 Chapter 8: Example 3 G H 3 Cost-volume analysis
1 Chapter 8: Example 3 G H 3 Cost-volume analysis -4 Perform a break even analysis using foxed cost and 5 variable costs. Find the best location for desired 6 volume. Indicate the best range for each location Plot the cost vs. volume for all locations 8 Data Bowling Green Chicago 10 Fixed cost 30000 60000 11000g 11 Variable cost 75 451 12 13 Volume optional) 2000 14 y=30000+75xy60000-45% ya 110000-25% 15 Results 16 Breakeven points Units Dollars 17 Akron vs. Bowling Gr 1000 105000 18 Akron vs. Chicago 1600 150000 19 Bowling Green vs. C 2500 172500 20 21 Volume analysis 2000 units Akron Bowling Green Chicago 23 Total cost w $ 150 000 00 $ 150 000 00 25 Graph Akron Bowling Green Chicago 30000 80000 110000 5000 405000 285000 235000 1 Chapter 8: Example 3 G H 3 Cost-volume analysis -4 Perform a break even analysis using foxed cost and 5 variable costs. Find the best location for desired 6 volume. Indicate the best range for each location Plot the cost vs. volume for all locations 8 Data Bowling Green Chicago 10 Fixed cost 30000 60000 11000g 11 Variable cost 75 451 12 13 Volume optional) 2000 14 y=30000+75xy60000-45% ya 110000-25% 15 Results 16 Breakeven points Units Dollars 17 Akron vs. Bowling Gr 1000 105000 18 Akron vs. Chicago 1600 150000 19 Bowling Green vs. C 2500 172500 20 21 Volume analysis 2000 units Akron Bowling Green Chicago 23 Total cost w $ 150 000 00 $ 150 000 00 25 Graph Akron Bowling Green Chicago 30000 80000 110000 5000 405000 285000 235000

Step by Step Solution

There are 3 Steps involved in it

1 Expert Approved Answer
Step: 1 Unlock blur-text-image
Question Has Been Solved by an Expert!

Get step-by-step solutions from verified subject matter experts

Step: 2 Unlock
Step: 3 Unlock

Students Have Also Explored These Related General Management Questions!