

Question: 1. Coerce the Date/Time variable to a date object and rename it Date. 2. Make a time series plot (with lines) of the daily maximum
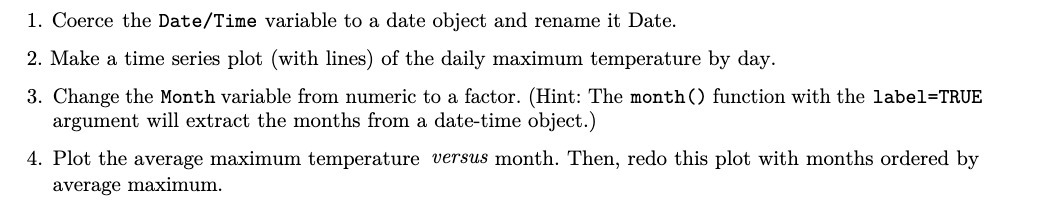
1. Coerce the Date/Time variable to a date object and rename it Date. 2. Make a time series plot (with lines) of the daily maximum temperature by day. 3. Change the Month variable from numeric to a factor. (Hint: The month() function with the 1abe1=TRUE argument will extract the months from a datetime object.) 4. Plot the average maximum temperature 'UETSUS month. Then, redo this plot with months Ordered by average maximum
Step by Step Solution
There are 3 Steps involved in it
1 Expert Approved Answer
Step: 1 Unlock

Question Has Been Solved by an Expert!
Get step-by-step solutions from verified subject matter experts
Step: 2 Unlock
Step: 3 Unlock