

Question: 1. Collect sample data, include the data, and use statistical methods to construct a condence interval to estimate a population proportion. Include at least 30

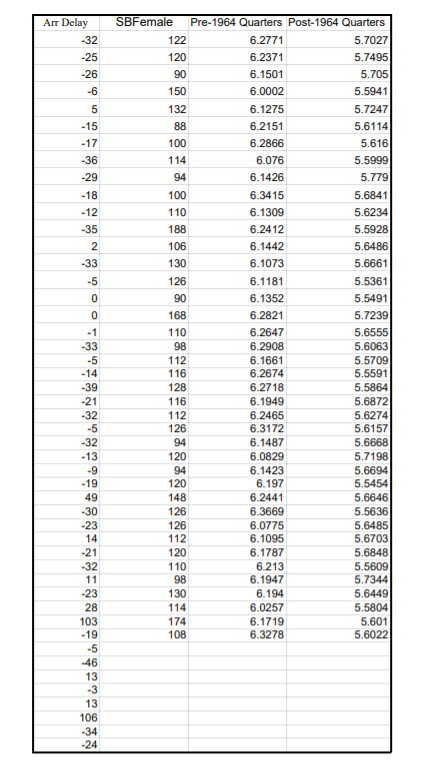
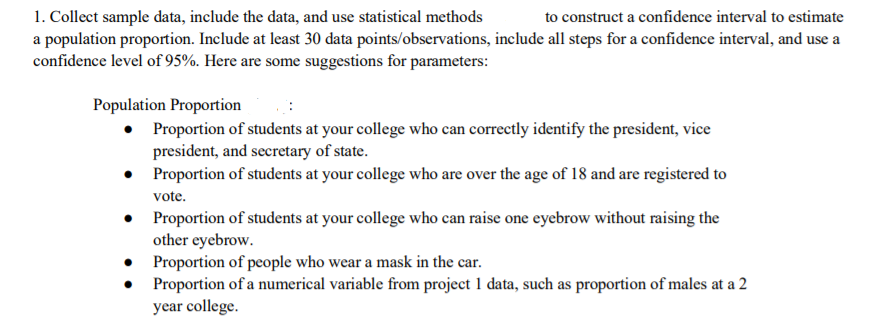


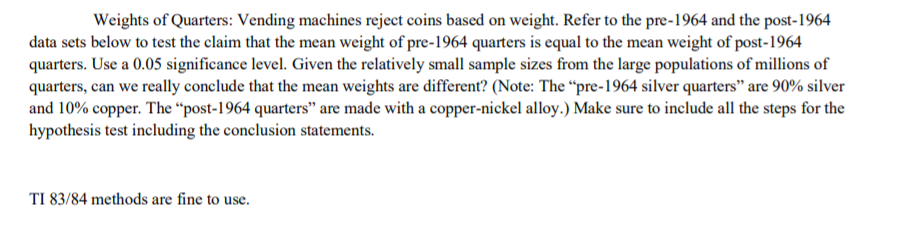

1. Collect sample data, include the data, and use statistical methods to construct a condence interval to estimate a population proportion. Include at least 30 data pointsr'observations, include all steps fora condence interval, and use a condence level of 95%. Here are some suggestions for parameters: Population Proportion . 0 Proportion of students at your college who can correctly identify the president, vice president, and secretary of state. i Proportion of students at your college who are over the age of 18 and are registered to vote. e Proportion of students at your college who can raise one eyebrow without raising the other eyebrow. II Proportion of people who wear a mask in the car. e Proportion ofa numerical variable from project 1 data. such as proportion of males at a 2 year college. 2. Collect sample data. include the data, and use statistical methods to construct a condence interval to estimate a population mean. include at least 30 data points'observations. include all steps for a condence interval. and use a condence level of95%. Here are some suggestions for parameters: Population Mean 0 Mean age of cars driven by statistics students andr'or the mean age of cars driven by faculty. e Mean length of words in New York Times editorials and mean length of words in editorials found in your local newspaper. Mean lengths of words in a magazine. Mean age offull-time students at your college. Mean number of hours that students at your college study each week. Mean of a numerical variable from project 1 data, such as mean number of hours of studied per weelc \fBlood Pressure: Use the systolic blood pressure measurements (see SB Female data below) for females to test the claim that the female population has a mean systolic blood pressure level less than 120.0 mm Hg. Use a 0.05 signicance level. Use the methods to conduct a hypothesis test. Make sure to include all the steps for the hypothesis test including the conclusion statements. Weights of Quarters: Vending machines reject coins based on weight. Refer to the pre-1964 and the post-1964 data sets below to test the claim that the mean weight of pre-l964 quarters is equal to the mean weight of post-1964 quarters. Use a 0.05 signicance level. Given the relatively small sample sizes 'orn the large populations of millions of quarters, can we really conclude that the mean weights are different? (Note: The \"pro-1964 silver quarters" are 90% silver and 10% copper. The \"post-1964 quarters" are made with a copper-nickel alloy.) Make sure to include all the steps forth-e hypothesis test including the conclusion statements. TI 33.184 methods are ne to use. Arr Delay SBFemale Pre-1964 Quarters Post-1964 Quarters -32 122 6.2771 5.7027 -25 120 6.2371 5.7495 -26 90 6.1501 5.705 -6 150 6.0002 5.5941 5 132 6.1275 5.7247 -15 88 6.2151 5.6114 -17 100 6.2866 5.616 -36 114 6.076 5.5999 -29 94 6.1426 5.779 -18 100 6.3415 5.6841 -12 110 6.1309 5.6234 -35 188 6.2412 5.5928 2 106 6.1442 5.6486 -33 130 6.1073 5.6661 126 6.1181 5.5361 90 6.1352 5.5491 168 6.2821 5.7239 110 6.2647 5.6555 98 6.2908 5.6063 -5 112 6.1661 5.5709 1 16 6.2674 5.5591 39 128 6.2718 5.5864 -21 116 6.1949 5.6872 -32 112 6.2465 5.6274 -5 126 6.3172 5.6157 -32 94 6.1487 5.6668 -13 120 6.0829 5.7198 -9 94 6.1423 5.6694 -19 120 6.197 5.5454 49 148 6.2441 5.6646 -30 126 6.3669 5.5636 -23 126 6.0775 5.6485 14 112 6.1095 5.6703 -21 120 6.1787 5.6848 -32 110 6.213 5.5609 11 98 6.1947 5.7344 -23 130 6.194 5.6449 28 114 6.0257 5.5804 103 174 6.1719 5.601 -19 108 6.3278 5.6022 -5 -46 13 -3 13 106 -34 -24
Step by Step Solution
There are 3 Steps involved in it

Get step-by-step solutions from verified subject matter experts