

Question: (1) Comparing the two companies, which do you think is in a stronger financial position. Why? (2) Do you like one of the statements' format
(1) Comparing the two companies, which do you think is in a stronger financial position. Why?
(2) Do you like one of the statements' format better than the other? If so, which one and why?
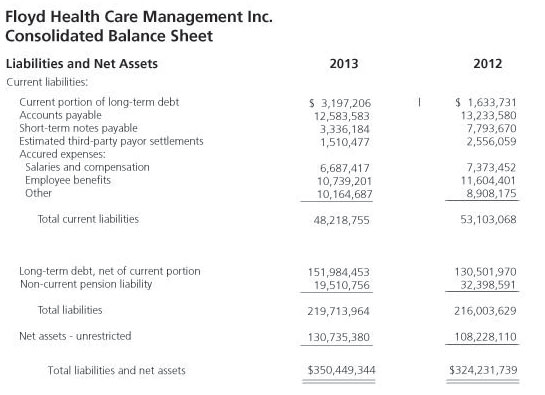

2013 2012 Floyd Health Care Management Inc. Consolidated Balance Sheet Liabilities and Net Assets Current liabilities: Current portion of long-term debt Accounts payable Short-term notes payable Estimated third-party payor settlements Accured expenses: Salaries and compensation Employee benefits Other $ 3,197,206 12,583,583 3,336,184 1,510,477 $ 1,633,731 13,233,580 7,793,670 2,556,059 6,687,417 10,739,201 10,164,687 7,373,452 11,604,401 8,908,175 Total current liabilities 48,218,755 53,103,068 Long-term debt, net of current portion Non-current pension liability 151,984,453 19,510,756 130,501,970 32,398,591 Total liabilities 219,713,964 216,003,629 Net assets- unrestricted 130,735,380 108,228,110 Total liabilities and net assets $350,449,344 $324,231,739 Estimates 2004-05 2005-06 $m Sm 2,840 19,314 31,300 24,745 14,663 92,863 1,956 20,536 38,290 25,837 14,909 101,529 66,769 4,837 65,607 4,256 69,863 162,726 71,607 173,136 GFS assets Financial assets Cash and deposits Advances paid Investments, loans and placements Other non-equity assets Equity Total financial assets Non-financial assets Land and fixed assets Other non-financial assets Total non-financial assets Total GF S as sets GFS liabilities Deposits held Advances received Government securities Loans Other borrowing Unfunded superannuation liability and other employee entitlements Other provisions Other non-equity liabilities Total GF S liabilities Shares and other contributed capital Net worth(a) Net financial worth(b) Net debt(c) 365 61,452 5,595 12,916 100,694 6,868 26,451 214,341 31,017 -82,633 - 152,496 26,874 365 0 59,284 5,164 12,834 105,595 7,019 27,682 217,943 31,017 -75,824 -147,431 16,863 2013 2012 Floyd Health Care Management Inc. Consolidated Balance Sheet Liabilities and Net Assets Current liabilities: Current portion of long-term debt Accounts payable Short-term notes payable Estimated third-party payor settlements Accured expenses: Salaries and compensation Employee benefits Other $ 3,197,206 12,583,583 3,336,184 1,510,477 $ 1,633,731 13,233,580 7,793,670 2,556,059 6,687,417 10,739,201 10,164,687 7,373,452 11,604,401 8,908,175 Total current liabilities 48,218,755 53,103,068 Long-term debt, net of current portion Non-current pension liability 151,984,453 19,510,756 130,501,970 32,398,591 Total liabilities 219,713,964 216,003,629 Net assets- unrestricted 130,735,380 108,228,110 Total liabilities and net assets $350,449,344 $324,231,739 Estimates 2004-05 2005-06 $m Sm 2,840 19,314 31,300 24,745 14,663 92,863 1,956 20,536 38,290 25,837 14,909 101,529 66,769 4,837 65,607 4,256 69,863 162,726 71,607 173,136 GFS assets Financial assets Cash and deposits Advances paid Investments, loans and placements Other non-equity assets Equity Total financial assets Non-financial assets Land and fixed assets Other non-financial assets Total non-financial assets Total GF S as sets GFS liabilities Deposits held Advances received Government securities Loans Other borrowing Unfunded superannuation liability and other employee entitlements Other provisions Other non-equity liabilities Total GF S liabilities Shares and other contributed capital Net worth(a) Net financial worth(b) Net debt(c) 365 61,452 5,595 12,916 100,694 6,868 26,451 214,341 31,017 -82,633 - 152,496 26,874 365 0 59,284 5,164 12,834 105,595 7,019 27,682 217,943 31,017 -75,824 -147,431 16,863
Step by Step Solution
There are 3 Steps involved in it

Get step-by-step solutions from verified subject matter experts