

Question: 1. Comparisons about the averages, standard deviation, and overall spread of each graph. 2. Describe the process that would be used to construct confidence intervals
1. Comparisons about the averages, standard deviation, and overall spread of each graph. 2. Describe the process that would be used to construct confidence intervals to capture the population average.
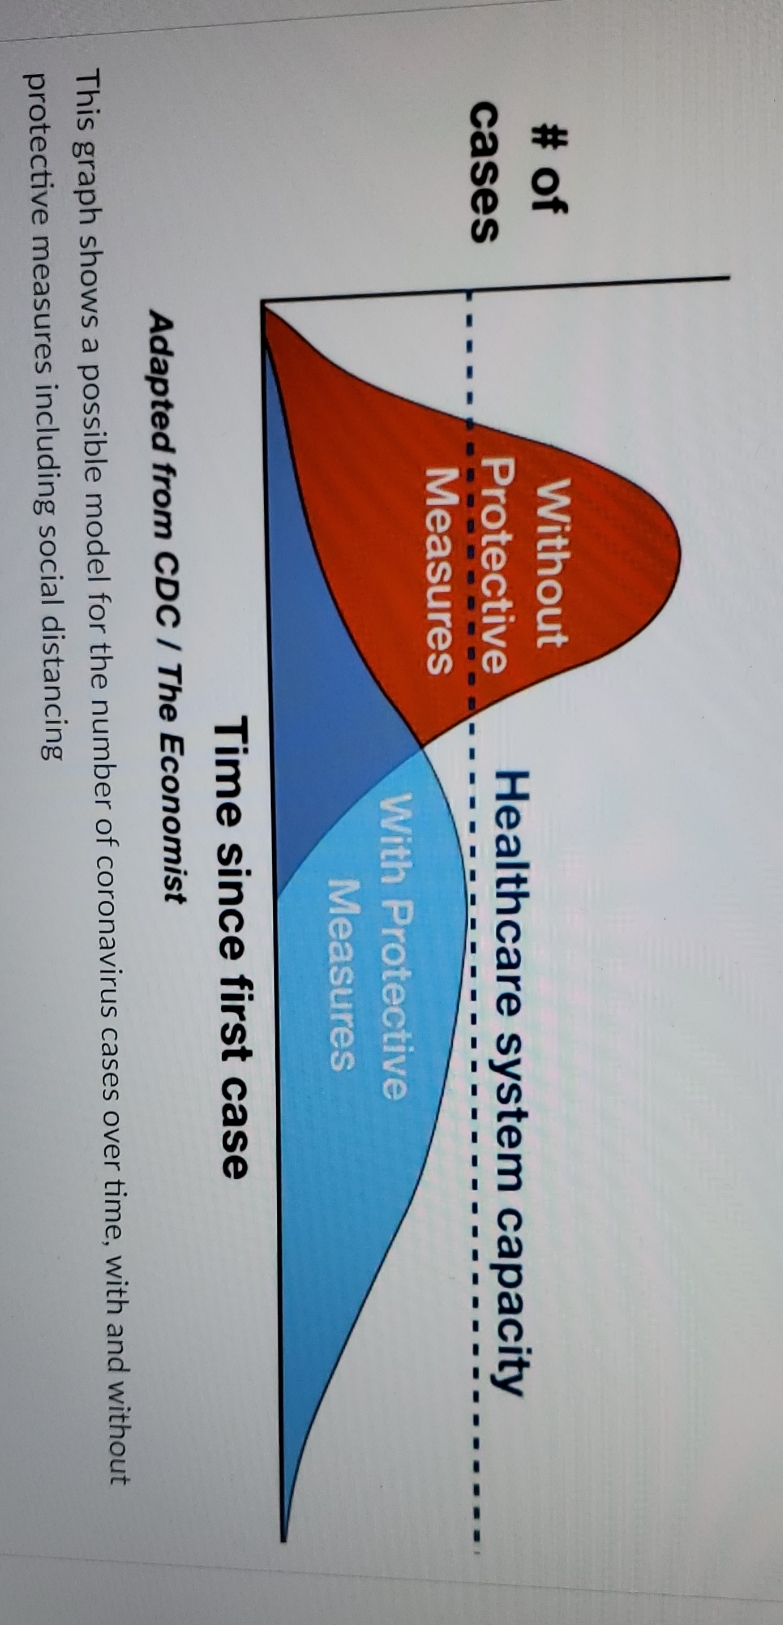
# of Without cases Protective Healthcare system capacity . . . . ...... Measures With Protective Measures Time since first case Adapted from CDC / The Economist This graph shows a possible model for the number of coronavirus cases over time, with and without protective measures including social distancing
Step by Step Solution
There are 3 Steps involved in it
1 Expert Approved Answer
Step: 1 Unlock

Question Has Been Solved by an Expert!
Get step-by-step solutions from verified subject matter experts
Step: 2 Unlock
Step: 3 Unlock