

Question: 1. Complete cash flow table in excel spreadsheet given the information provided. 2. Calculate Net Present Value (NPV) using the information you get on your
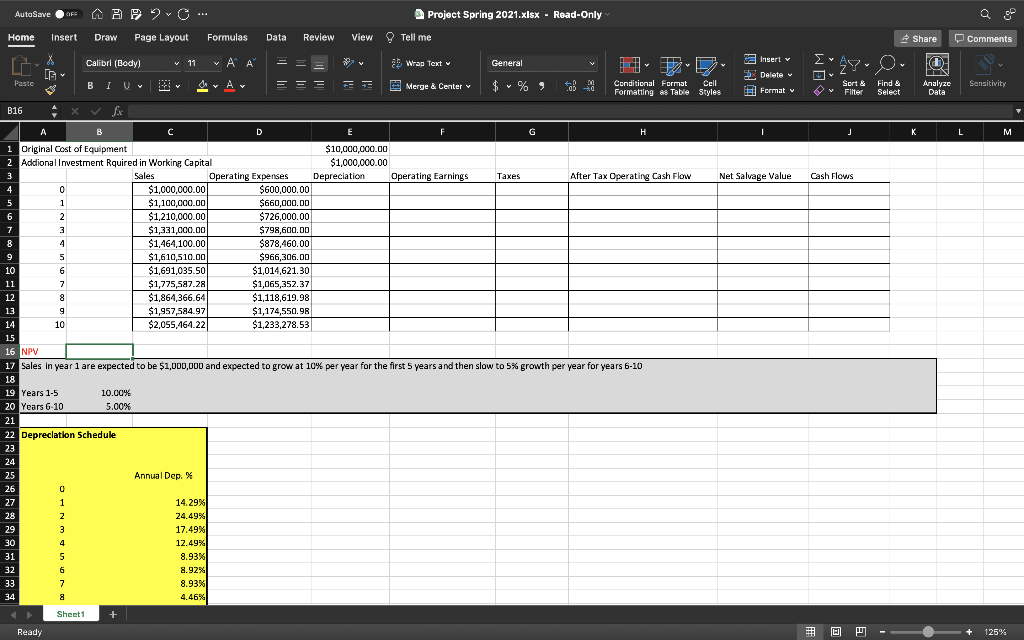
1. Complete cash flow table in excel spreadsheet given the information provided.
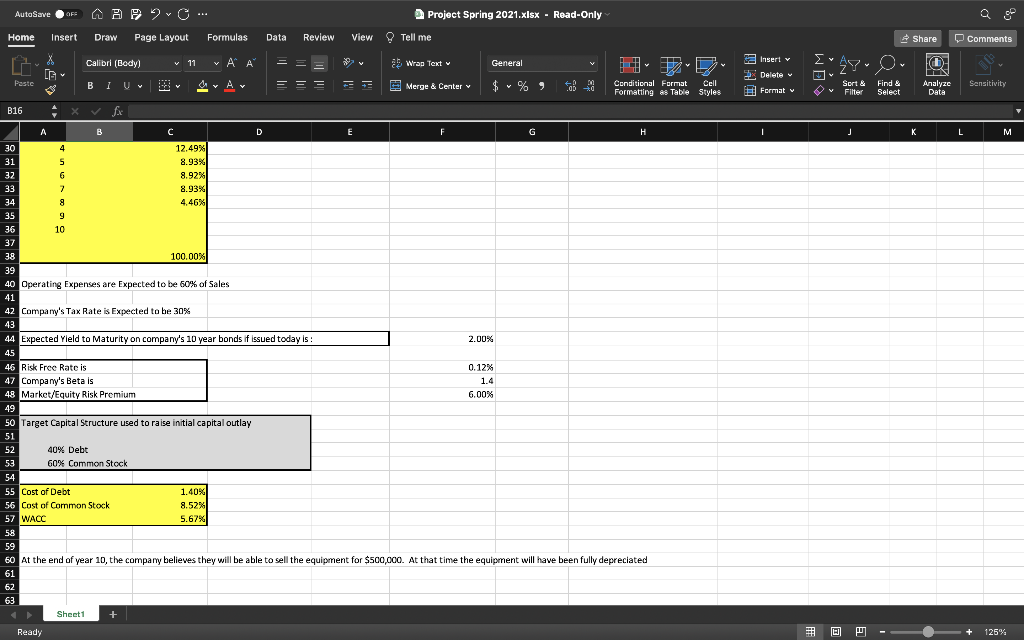
2. Calculate Net Present Value (NPV) using the information you get on your spreadsheet and any other information needed which is provided in excel spreadsheet.
3. Provide a conclusion as to whether you would undertake the project or not and the reasons for your decision.
AutoSave OF AA? 2... Project Spring 2021.xlsx - Read-Only Home Insert Draw Page Layout Formulas Data Review View Tell me Share Comments Calibri (Body) v 11 v AA X C. G 5 Wrap Text General Insert v Y O [ v Delete v Paste BI I U Av Y = = = -- Merge & Center v Y Conditional Format Cell Formatting as Table Styles Sort & Filter Format v Find & Select Analyze Data Sensitivity V B16 fx I J L M Net Salvage Value Cash Flows A B C D E G H i Original Cost of Equipment $10,000,000.00 2 Addional Investment Rquired in Working Capital $1,000,000.00 3 Sales Operating Expenses Depreciation Operating Earnings Taxes After Tax Operating Cash Flow 4 0 $1,000,000.00 $600,000.00 5 1 $1,100,000.00 $660,000.00 6 2 $1,210,000.00 $726,000.00 7 3 $1,331,000.00 $798,600.00 8 4 $1,464 100.00 $878,460.00 9 5 $1,610,510.00 $966,306.00 10 6 $1,691,035.500 $1,014,621.30 11 7 $1,775,587 28 $1,065,352.37 12 8 $1,864,366.64 $1,118,619.98 13 9 $1,957,584.97 $1,174,550.9 14 10 $2,055,464.22 $1,233,278.53 15 16 NPV 17 Sales in year 1 are expected to be $1,000,000 and expected to grow at 10% per year for the first 5 years and then slow to 5% growth per year for years 6-10 18 19 Years 1.5 10.00% 20 Years 6-10 5.00% 21 22 Depreciation Schedule 23 24 25 Annual Dep. % 26 0 27 1 14.29% 28 Z 24.49% 29 3 17.49% 30 4 12.49% 31 5 8.93% 32 6 8.92% 33 7 8.93% 34 4.46% Sheet1 + Ready 125% AutoSave OF A APO". Project Spring 2021.xlsx - Read-Only View Tell me Home Insert Draw Page Layout Formulas Data Review Share Comments Calibri (Body) v 11 v AP X C. [G 5 Wrap Text General Insert v ' , AYO 0 v Delete v Paste I U AYA Av Y = = = Merge & Center . Y Sensitivity Conditional Format Cell Formatting as Table Styles Sort & Filter # Format Find & Select Analyze Data V I J L M B16 fx A B C D E F G H 30 4 12.49% 31 5 8.93% 32 6 8.92% 33 7 8.93% 34 8 4.46% 35 9 36 10 37 38 100.00% 39 40 Operating Expenses are expected to be 60% of Sales 41 42 Company's Tax Rate is Expected to be 30% 43 44 Expected Yield to Maturity on company's 10 year bonds if issued today is : : 2.00% 45 46 Risk Free Rate is 0.12% 47 Company's Beta is 1.4 48 Market/Equity Risk Premium 6.00% 49 50 Target Capital Structure used to raise initial capital outlay 51 52 40% Debt 53 60% Common Stock 54 55 Cost of Debt 1.40% 56 Cost of Common Stock 8.52% 57 WACC 5.67% 58 59 60 At the end of year 10, the company believes they will be able to sell the equipment for $500,000. At that time the equipment will have been fully depreciated 61 62 63 Sheet1 + Ready + 125% AutoSave OF AA? 2... Project Spring 2021.xlsx - Read-Only Home Insert Draw Page Layout Formulas Data Review View Tell me Share Comments Calibri (Body) v 11 v AA X C. G 5 Wrap Text General Insert v Y O [ v Delete v Paste BI I U Av Y = = = -- Merge & Center v Y Conditional Format Cell Formatting as Table Styles Sort & Filter Format v Find & Select Analyze Data Sensitivity V B16 fx I J L M Net Salvage Value Cash Flows A B C D E G H i Original Cost of Equipment $10,000,000.00 2 Addional Investment Rquired in Working Capital $1,000,000.00 3 Sales Operating Expenses Depreciation Operating Earnings Taxes After Tax Operating Cash Flow 4 0 $1,000,000.00 $600,000.00 5 1 $1,100,000.00 $660,000.00 6 2 $1,210,000.00 $726,000.00 7 3 $1,331,000.00 $798,600.00 8 4 $1,464 100.00 $878,460.00 9 5 $1,610,510.00 $966,306.00 10 6 $1,691,035.500 $1,014,621.30 11 7 $1,775,587 28 $1,065,352.37 12 8 $1,864,366.64 $1,118,619.98 13 9 $1,957,584.97 $1,174,550.9 14 10 $2,055,464.22 $1,233,278.53 15 16 NPV 17 Sales in year 1 are expected to be $1,000,000 and expected to grow at 10% per year for the first 5 years and then slow to 5% growth per year for years 6-10 18 19 Years 1.5 10.00% 20 Years 6-10 5.00% 21 22 Depreciation Schedule 23 24 25 Annual Dep. % 26 0 27 1 14.29% 28 Z 24.49% 29 3 17.49% 30 4 12.49% 31 5 8.93% 32 6 8.92% 33 7 8.93% 34 4.46% Sheet1 + Ready 125% AutoSave OF A APO". Project Spring 2021.xlsx - Read-Only View Tell me Home Insert Draw Page Layout Formulas Data Review Share Comments Calibri (Body) v 11 v AP X C. [G 5 Wrap Text General Insert v ' , AYO 0 v Delete v Paste I U AYA Av Y = = = Merge & Center . Y Sensitivity Conditional Format Cell Formatting as Table Styles Sort & Filter # Format Find & Select Analyze Data V I J L M B16 fx A B C D E F G H 30 4 12.49% 31 5 8.93% 32 6 8.92% 33 7 8.93% 34 8 4.46% 35 9 36 10 37 38 100.00% 39 40 Operating Expenses are expected to be 60% of Sales 41 42 Company's Tax Rate is Expected to be 30% 43 44 Expected Yield to Maturity on company's 10 year bonds if issued today is : : 2.00% 45 46 Risk Free Rate is 0.12% 47 Company's Beta is 1.4 48 Market/Equity Risk Premium 6.00% 49 50 Target Capital Structure used to raise initial capital outlay 51 52 40% Debt 53 60% Common Stock 54 55 Cost of Debt 1.40% 56 Cost of Common Stock 8.52% 57 WACC 5.67% 58 59 60 At the end of year 10, the company believes they will be able to sell the equipment for $500,000. At that time the equipment will have been fully depreciated 61 62 63 Sheet1 + Ready + 125%
Step by Step Solution
There are 3 Steps involved in it

Get step-by-step solutions from verified subject matter experts