

Question: 1. Complete the below table to calculate each years current ratio. Options for Choose Numerator: Accounts receivable, Cost of goods sold, Current assets, Current liabilities,
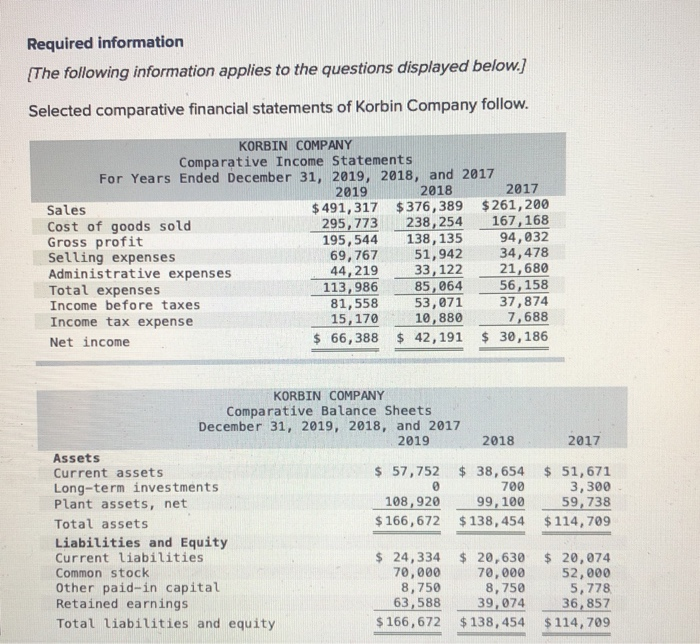
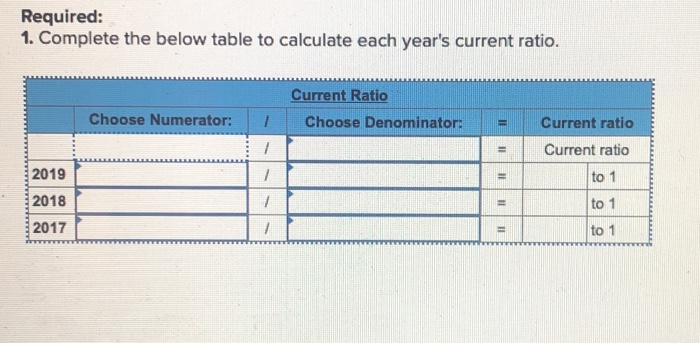
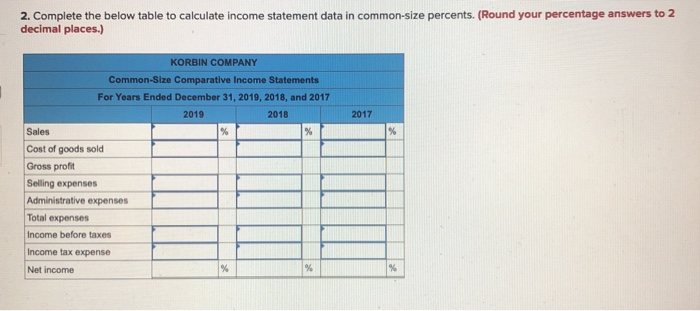
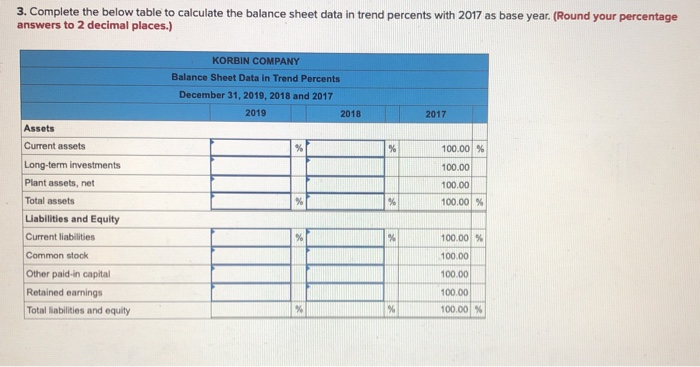
Required information [The following information applies to the questions displayed below.) Selected comparative financial statements of Korbin Company follow. KORBIN COMPANY Comparative Income Statements For Years Ended December 31, 2019, 2018, and 2017 2019 2018 2017 Sales $ 491, 317 $376, 389 $261,200 Cost of goods sold 295, 773 238,254 167,168 Gross profit 195,544 138, 135 94,032 Selling expenses 69, 767 51,942 34,478 Administrative expenses 44,219 33, 122 21,680 Total expenses 113,986 85,064 56,158 Income before taxes 81,558 53,071 37,874 Income tax expense 15,170 10,880 7,688 Net income $ 66,388 $ 42,191 $ 30,186 2017 KORBIN COMPANY Comparative Balance Sheets December 31, 2019, 2018, and 2017 2019 2018 Assets Current assets $ 57,752 $ 38,654 Long-term investments 700 Plant assets, net 108,920 99, 100 Total assets $ 166,672 $ 138,454 Liabilities and Equity Current liabilities $ 24,334 $ 20,630 Common stock 70,000 70,000 Other paid-in capital 8,750 8,750 Retained earnings 63,588 39,074 Total liabilities and equity $ 166,672 $ 138,454 $ 51, 671 3,300 59,738 $ 114,709 $ 20,074 52,000 5,778 36,857 $ 114,709 Required: 1. Complete the below table to calculate each year's current ratio. Current Ratio Choose Numerator: Choose Denominator: Il 1 1 Current ratio Current ratio = 7 11 to 1 2019 2018 7 11 to 1 2017 11 to 1 2. Complete the below table to calculate income statement data in common-size percents. (Round your percentage answers to 2 decimal places.) 2017 % KORBIN COMPANY Common-Size Comparative Income Statements For Years Ended December 31, 2019, 2018, and 2017 2019 2018 Sales % % Cost of goods sold Gross profit Selling expenses Administrative expenses Total expenses Income before taxes Income tax expense Net income % % % 3. Complete the below table to calculate the balance sheet data in trend percents with 2017 as base year. (Round your percentage answers to 2 decimal places.) KORBIN COMPANY Balance Sheet Data in Trend Percents December 31, 2019, 2018 and 2017 2019 2018 2017 Assets % % 100.00 % 100.00 100.00 % % 100.00% Current assets Long-term investments Plant assets, net Total assets Liabilities and Equity Current liabilities Common stock Other paid-in capital Retained earnings Total liabilities and equity % % 100.00 % 100.00 100.00 100.00 100.00 % % % 4. Refer to the results from parts 1, 2, and 3. (a) Did cost of goods sold make up a greater portion of sales for the most recent year? Yes O No (b) Did income as a percent of sales improve in the most recent year? Yes ONo (c) Did plant assets grow over this period? Yes No
Step by Step Solution
There are 3 Steps involved in it

Get step-by-step solutions from verified subject matter experts