

Question: 1. Complete the below table to calculate each year's current ratio. 2. Complete the below table to calculate income statement data in common-size percents. (Round
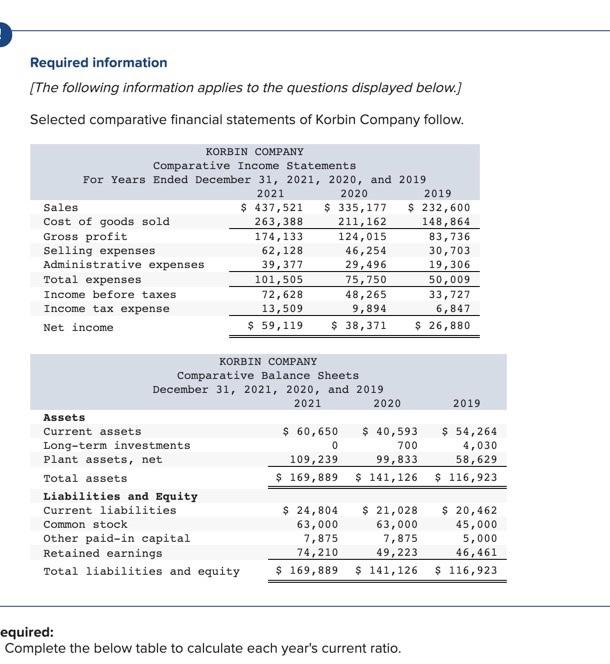
Required information [The following information applies to the questions displayed below.) Selected comparative financial statements of Korbin Company follow. KORBIN COMPANY Comparative Income Statements For Years Ended December 31, 2021, 2020, and 2019 2021 2020 2019 Sales $ 437,521 $ 335,177 $ 232,600 Cost of goods sold 263,388 211,162 148,864 Gross profit 174, 133 124,015 83,736 Selling expenses 62,128 46,254 30, 703 Administrative expenses 39, 377 29,496 19,306 Total expenses 101,505 75, 750 50,009 Income before taxes 72,628 48,265 33, 727 Income tax expense 13,509 9,894 6,847 Net income $ 59, 119 $ 38,371 $ 26,880 2019 KORBIN COMPANY Comparative Balance Sheets December 31, 2021, 2020, and 2019 2021 2020 Assets Current assets $ 60, 650 $ 40,593 Long-term investments 0 700 Plant assets, net 109, 239 99,833 Total assets $ 169,889 $ 141,126 Liabilities and Equity Current liabilities $ 24,804 $ 21,028 Common stock 63,000 63,000 Other paid-in capital 7,875 7,875 Retained earnings 74,210 49,223 Total liabilities and equity $ 169,889 $ 141, 126 $ 54,264 4,030 58,629 $ 116,923 $ 20,462 45,000 5,000 46, 461 $ 116,923 equired: Complete the below table to calculate each year's current ratio
Step by Step Solution
There are 3 Steps involved in it

Get step-by-step solutions from verified subject matter experts