

Question: 1) Complete the following table: Variable Factor Total Product Average Product Marginal Product 1 10 2 160 3 330 4 480 5 600 6 670
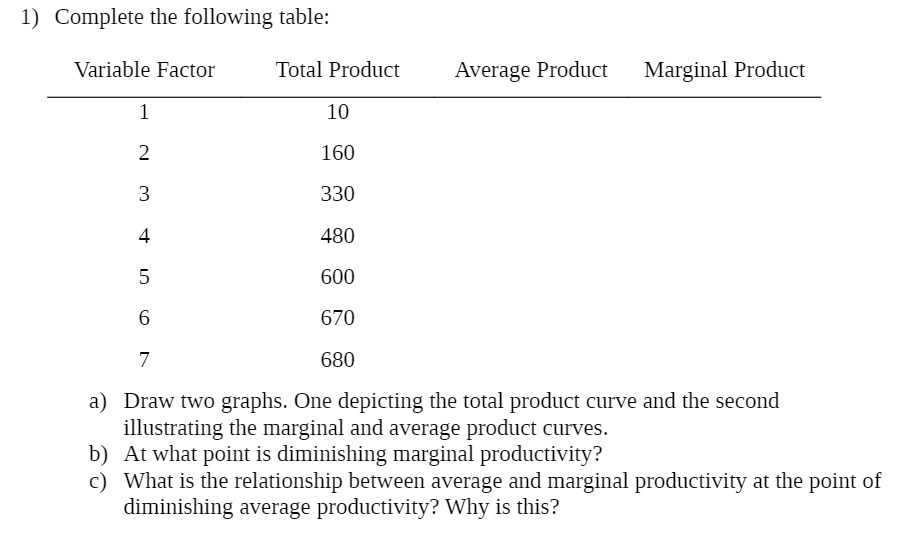
1) Complete the following table: Variable Factor Total Product Average Product Marginal Product 1 10 2 160 3 330 4 480 5 600 6 670 7 680 a) Draw two graphs. One depicting the total product curve and the second illustrating the marginal and average product curves. b) At what point is diminishing marginal productivity? c) What is the relationship between average and marginal productivity at the point of diminishing average productivity? Why is this
Step by Step Solution
There are 3 Steps involved in it
1 Expert Approved Answer
Step: 1 Unlock

Question Has Been Solved by an Expert!
Get step-by-step solutions from verified subject matter experts
Step: 2 Unlock
Step: 3 Unlock