

Question: 1. Complete the table below, using the information and formulas provided in class 8 (see PDF document posted on Blackboard, Weekly Schedule tab, Week 8).

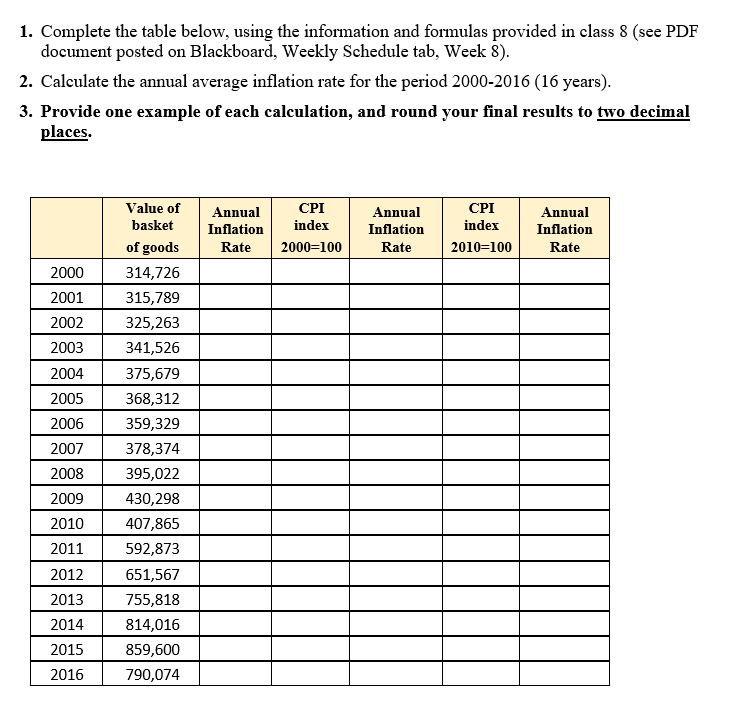
1. Complete the table below, using the information and formulas provided in class 8 (see PDF document posted on Blackboard, Weekly Schedule tab, Week 8). 2. Caleulate the annual average inflation rate for the period 2000-2016 (16 years). 3. Provide one example of each calculation, and round your final results to two decimal places. Value of Annual CPI Annual CPI Annual basket Inflation index Inflation index Inflation of goods Rate 2000=100 Rate 2010=100 Rate 2002 2007 2008 2012 2013 2015 2016 790,074
Step by Step Solution
There are 3 Steps involved in it
1 Expert Approved Answer
Step: 1 Unlock

Question Has Been Solved by an Expert!
Get step-by-step solutions from verified subject matter experts
Step: 2 Unlock
Step: 3 Unlock