

Question: 1. Complete the vertical analysis by computing each missing line item as a percentage of sales revenues. (Round your answers to the nearest whole percent.)
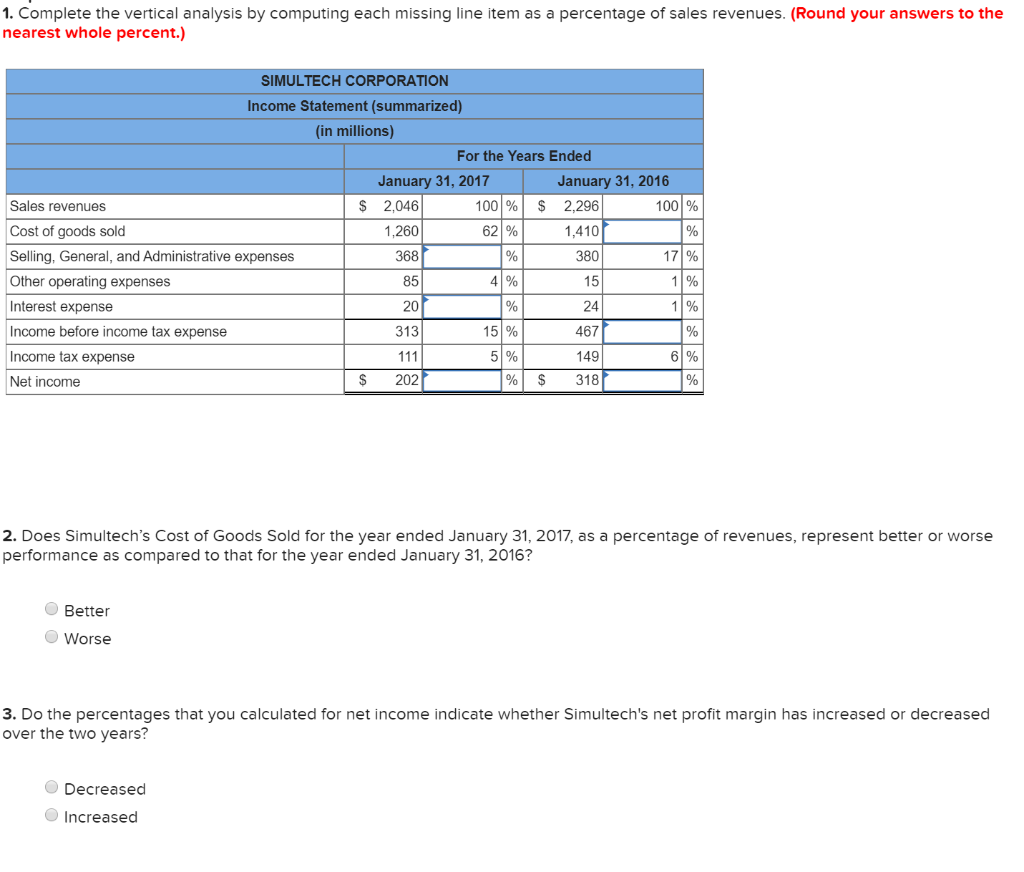
1. Complete the vertical analysis by computing each missing line item as a percentage of sales revenues. (Round your answers to the nearest whole percent.) SIMULTECH CORPORATION Income Statement (summarized) (in millions) For the Years Ended January 31, 2017 January 31, 2016 Sales revenues $ 2,046 100% $ 2,296 100 % Cost of goods sold 1,260 62 % 1,410 Selling, General, and Administrative expenses 368 % 380 Other operating expenses 854 % 15 Interest expense % 24| Income before income tax expense 313 15% Income tax expense - 111| 5% 1496 Net income $ 202 % $ 318 20 467 2. Does Simultech's Cost of Goods Sold for the year ended January 31, 2017, as a percentage of revenues, represent better or worse performance as compared to that for the year ended January 31, 2016? Better Worse 3. Do the percentages that you calculated for net income indicate whether Simultech's net profit margin has increased or decreased over the two years? Decreased Increased
Step by Step Solution
There are 3 Steps involved in it

Get step-by-step solutions from verified subject matter experts