

Question: 1. Compute the MAD, MSE and MAPE for the SECOND/FINAL regression model with trend and seasonality (the one with 2 binary variables). Use all 20
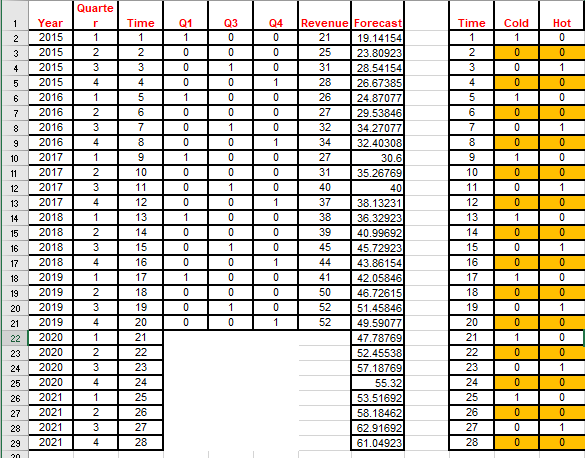
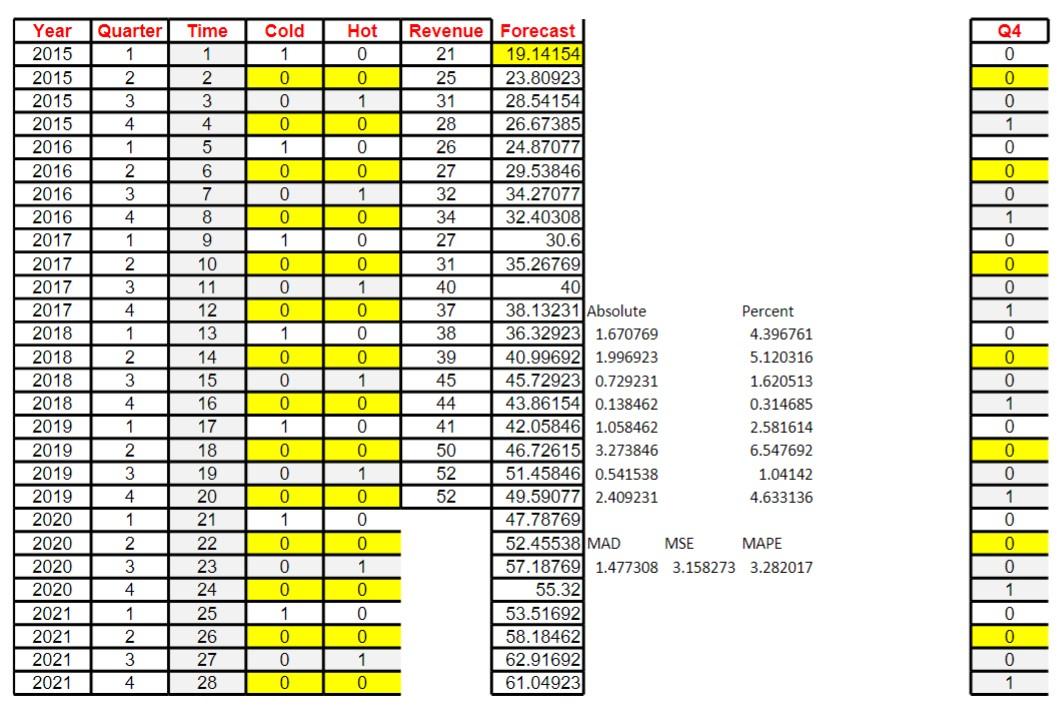
1. Compute the MAD, MSE and MAPE for the SECOND/FINAL regression model with trend and seasonality (the one with 2 binary variables). Use all 20 historical observations for the computation.
a) What was the MAD? [express your answer with 2 decimal accuracy]
b) What was the MSE? [express your answer with 2 decimal accuracy]
c) What was the MAPE? [express your answer in decimal form, with 3 decimal accuracy]
2. Which model was better?
a) Regression with time index (trend only)
b) Regression with time index and binaries (trend and seasonality)
c) Exponential smoothing (alpha = 0.2)
d) Exponential smoothing (alpha = 0.5)
1 Q3 0 04 Q1 1 0 0 0 Hot 0 0 1 0 N2 + N 00 O 1 0 0 0 1 0 0 0 1 0 0 0 0 0 1 0 0 Quarte r 1 2 3 4 1 2 3 4 1 2 3 4 1 2 3 4 0 0 1 0 0 3 4 5 6 7 8 9 10 11 12 13 14 15 16 17 18 19 20 21 22 23 24 25 26 27 28 29 0 1 Year 2015 2015 2015 2015 2016 2016 2016 2016 2017 2017 2017 2017 2018 2018 2018 2018 2019 2019 2019 2019 2020 2020 2020 2020 2021 2021 2021 2021 Time 1 2 3 4 5 6 7 8 9 10 11 12 13 14 15 16 17 18 19 20 21 22 23 24 25 26 27 28 1 0 0 0 1 0 0 0 1 0 0 0 1 0 1 0 0 0 1 0 0 0 1 0 0 0 1 0 0 Revenue Forecast 21 19.14154 25 23.809231 31 28.54154 28 26.67385 26 24.87077 27 29.53846 32 34.270771 34 32.40308 27 30.6 31 35.26769 40 40 37 38.132311 38 36.32923 39 40.99692 45 45.72923 44 43.86154 41 42.05846 50 46.72615 52 51.45846 52 49.59077 47.78769 52.45538 57.18769 55.32 53.516921 58.18462 62.916921 61.04923 Time 1 2 3 4 5 6 7 8 9 10 11 12 13 14 15 16 17 18 19 20 21 22 23 24 25 26 27 28 Cold 1 0 0 0 1 0 0 0 1 0 0 0 1 0 0 0 1 0 0 0 1 0 0 0 1 0 0 0 0 0 0 1 0 0 1 0 Pool-10 0 0 1 0 1 2 3 4 1 2 3 4 1 2 3 4 0 1 0 0 0 1 ww 0 20 Cold 1 0 Time 1 2 3 4 5 Hot 0 0 1 0 0 0 1 0 0 6 7 8 9 Year 2015 2015 2015 2015 2016 2016 2016 2016 2017 2017 2017 2017 2018 2018 2018 2018 2019 2019 2019 2019 2020 2020 2020 2020 2021 2021 2021 2021 Quarter 1 2 3 4 1 2 3 4 1 2 3 4 1 2 3 4 1 2 3 4 1 2 3 4 1 2 3 0 0 0 1 0 0 0 1 0 1 0 0 0 1 0 0 0 1 0 0 Revenue Forecast 21 19.14154 25 23.80923 31 28.54154 28 26.67385 26 24.87077 27 29.53846) 32 34.27077 34 32.40308 27 30.6 31 35.26769 40 40 37 38.13231 Absolute Percent 38 36.32923 1.670769 4.396761 39 40.99692) 1.996923 5.120316 45 45.729231 0.729231 1.620513 44 43.86154 0.138462 0.314685 41 42.05846 1.058462 2.581614 50 46.72615 3.273846 6.547692 52 51.45846 0.541538 1.04142 52 49.590772.409231 4.633136 47.78769 52.45538 MAD MSE MAPE 57.18769 1.477308 3.158273 3.282017 55.32 53.516921 58.18462 62.91692 61.04923 Q4 0 0 0 1 0 0 0 1 0 0 0 1 0 0 0 1 0 0 0 1 0 0 0 1 0 0 0 1 10 11 12 13 14 15 16 17 18 19 20 21 22 23 24 25 26 27 28 0 0 1 0 0 0 1 0 1 0 0 0 0 0 1 0 0 0 1 0 0 0 1 0 4 0Step by Step Solution
There are 3 Steps involved in it
1 Expert Approved Answer
Step: 1 Unlock

Question Has Been Solved by an Expert!
Get step-by-step solutions from verified subject matter experts
Step: 2 Unlock
Step: 3 Unlock