

Question: 1. Confidence Intervals Below are descriptive statistics based on data collected from a random sample of 400 students at Rutgers-Newark. Table 1. Number of hours
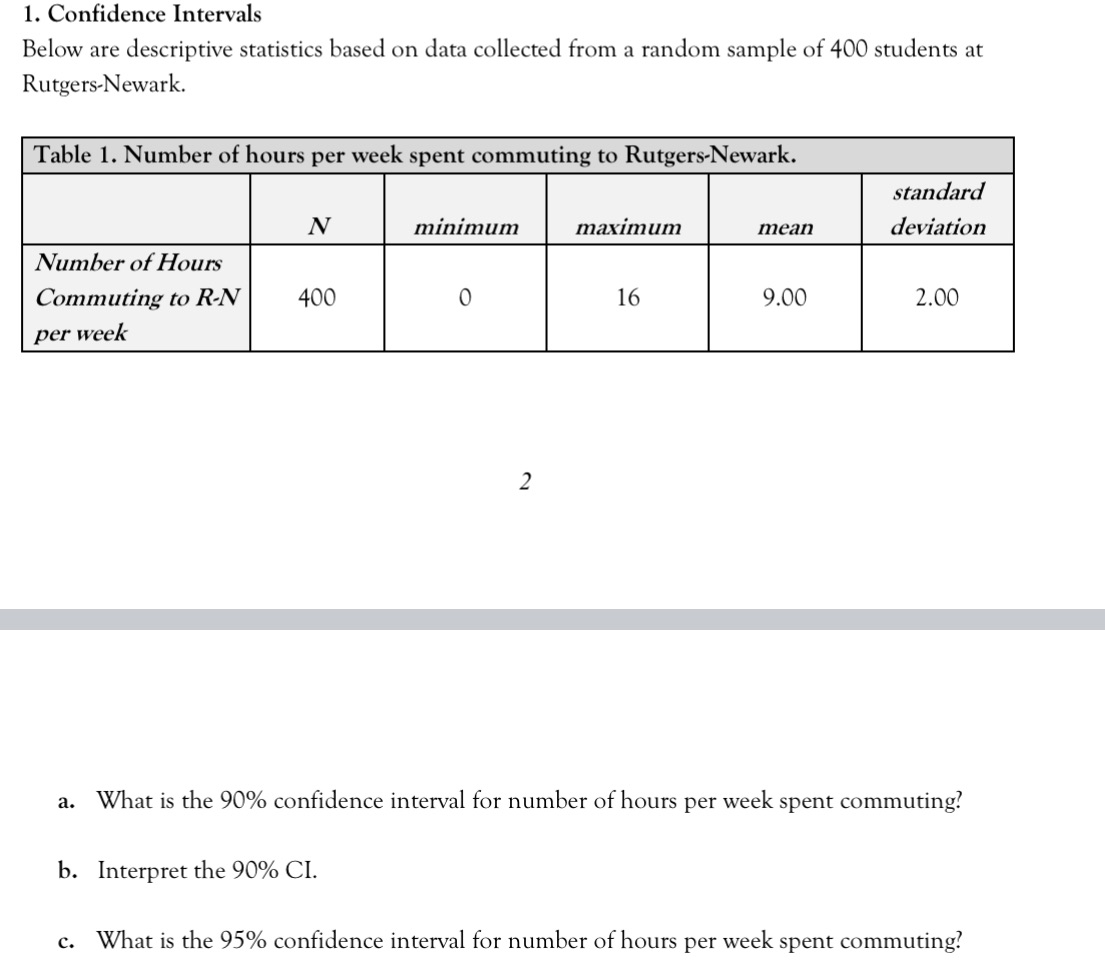
1. Confidence Intervals Below are descriptive statistics based on data collected from a random sample of 400 students at Rutgers-Newark. Table 1. Number of hours per week spent commuting to Rutgers-Newark. standard N minimum maximum mean deviation Number of Hours Commuting to R-N 400 0 16 9.00 2.00 per week N a. What is the 90% confidence interval for number of hours per week spent commuting? b. Interpret the 90% CI. c. What is the 95% confidence interval for number of hours per week spent commuting
Step by Step Solution
There are 3 Steps involved in it
1 Expert Approved Answer
Step: 1 Unlock

Question Has Been Solved by an Expert!
Get step-by-step solutions from verified subject matter experts
Step: 2 Unlock
Step: 3 Unlock