

Question: 1. Consider a sample with data values of 10, 20, 12, 17, and 16. Compute the mean and median. 2. Consider a sample with data
1. Consider a sample with data values of 10, 20, 12, 17, and 16. Compute the mean and median.
2. Consider a sample with data values of 10, 20, 21, 17, 16, and 12. Compute the mean and median.
3. Consider the following data and corresponding weights.
| xi | Weight (wi) |
| 3.2 | 6 |
| 2.0 | 3 |
| 2.5 | 2 |
| 5.0 | 8 |
a. Compute the weighted mean.
b. Compute the sample mean of the four data values without weighting. Note the difference in the results provided by the two computations.
4. Consider the following data.
| Period | Rate of Return (%) |
| 1 | -6.0 |
| 2 | -8.0 |
| 3 | -4.0 |
| 4 | 2.0 |
| 5 | 5.4 |
What is the mean growth rate over these five periods?
5. Consider a sample with data values of 27, 25, 20, 15, 30, 34, 28, and 25. Compute the 20th, 25th, 65th, and 75th percentiles.
6. Consider a sample with data values of 53, 55, 70, 58, 64, 57, 53, 69, 57, 68, and 53. Compute the mean, median, and mode.
7. Consider a sample with data values of 10, 20, 12, 17, and 16. Compute the range and interquartile range.
8. Consider a sample with data values of 10, 20, 12, 17, and 16. Compute the variance and standard deviation.
9. Consider a sample with data values of 27, 25, 20, 15, 30, 34, 28, and 25. Compute the range, interquartile range, variance, and standard deviation.
10. Consider a sample with data values of 10, 20, 12, 17, and 16. Compute the z-score for each of the five observations.
11. Consider a sample with data values of 27, 25, 20, 15, 30, 34, 28, and 25. Provide the five-number summary for the data.
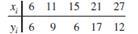
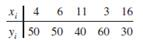
12. Five observations taken for two variables follow.
17\f
Step by Step Solution
There are 3 Steps involved in it

Get step-by-step solutions from verified subject matter experts