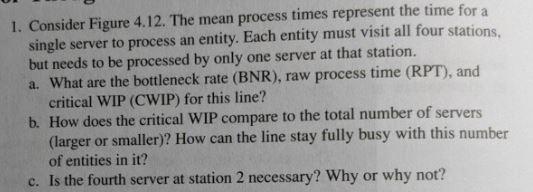
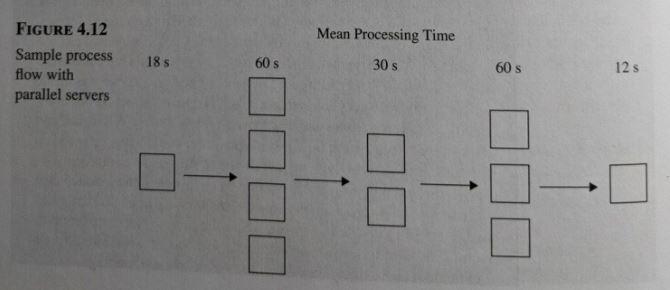
Question: 1. Consider Figure 4.12. The mean process times represent the time for a single server to process an entity. Each entity must visit all four

1. Consider Figure 4.12. The mean process times1. Consider Figure 4.12. The mean process times

1. Consider Figure 4.12. The mean process times represent the time for a single server to process an entity. Each entity must visit all four stations, but needs to be processed by only one server at that station. a. What are the bottleneck rate (BNR), raw process time (RPT), and critical WIP (CWIP) for this line? b. How does the critical WIP compare to the total number of servers (larger or smaller)? How can the line stay fully busy with this number of entities in it? c. Is the fourth server at station 2 necessary? Why or why not? Mean Processing Time FIGURE 4.12 Sample process flow with parallel servers 18 s 60 s 30 s 60 s 12 s

Step by Step Solution

There are 3 Steps involved in it

1 Expert Approved Answer
Step: 1 Unlock blur-text-image
Question Has Been Solved by an Expert!

Get step-by-step solutions from verified subject matter experts

Step: 2 Unlock
Step: 3 Unlock

Students Have Also Explored These Related General Management Questions!