

Question: 1. Consider the application comprising seven threads and characterized by the following precedence graph The execution time for each thread is specified in the following
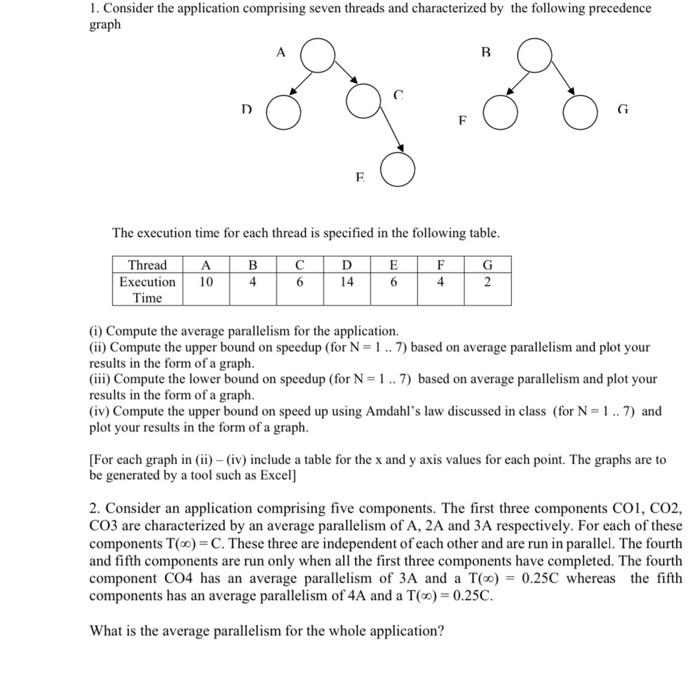
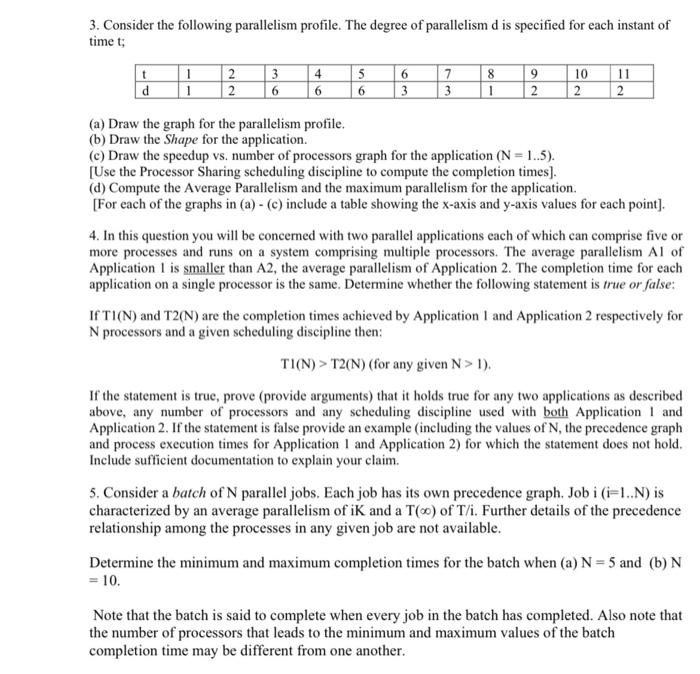
1. Consider the application comprising seven threads and characterized by the following precedence graph The execution time for each thread is specified in the following table. (i) Compute the average parallelism for the application. (ii) Compute the upper bound on speedup (for N=1..7 ) based on average parallelism and plot your results in the form of a graph. (iii) Compute the lower bound on speedup (for N=1..7 ) based on average parallelism and plot your results in the form of a graph. (iv) Compute the upper bound on speed up using Amdahl's law discussed in class (for N=1..7 ) and plot your results in the form of a graph. [For each graph in (ii) - (iv) include a table for the x and y axis values for each point. The graphs are to be generated by a tool such as Excel] 2. Consider an application comprising five components. The first three components CO1,CO2, CO3 are characterized by an average parallelism of A,2A and 3A respectively. For each of these components T()=C. These three are independent of each other and are run in parallel. The fourth and fifth components are run only when all the first three components have completed. The fourth component CO4 has an average parallelism of 3A and a T()=0.25C whereas the fifth components has an average parallelism of 4A and a T()=0.25C. What is the average parallelism for the whole application? 3. Consider the following parallelism profile. The degree of parallelism d is specified for each instant of time t; (a) Draw the graph for the parallelism profile. (b) Draw the Shape for the application. (c) Draw the speedup vs. number of processors graph for the application (N=1..5). [Use the Processor Sharing scheduling discipline to compute the completion times]. (d) Compute the Average Parallelism and the maximum parallelism for the application. [For each of the graphs in (a) - (c) include a table showing the x-axis and y-axis values for each point]. 4. In this question you will be concerned with two parallel applications each of which can comprise five or more processes and runs on a system comprising multiple processors. The average parallelism Al of Application 1 is smaller than A2, the average parallelism of Application 2. The completion time for each application on a single processor is the same. Determine whether the following statement is true or false: If T1(N) and T2(N) are the completion times achieved by Application 1 and Application 2 respectively for N processors and a given scheduling discipline then: T1(N)>T2(N)(foranygivenN>1). If the statement is true, prove (provide arguments) that it holds true for any two applications as described above, any number of processors and any scheduling discipline used with both Application 1 and Application 2. If the statement is false provide an example (including the values of N, the precedence graph and process execution times for Application 1 and Application 2) for which the statement does not hold. Include sufficient documentation to explain your claim. 5. Consider a batch of N parallel jobs. Each job has its own precedence graph. Job i(i=1...N) is characterized by an average parallelism of iK and a T() of T/i. Further details of the precence relationship among the processes in any given job are not available. Determine the minimum and maximum completion times for the batch when (a) N=5 and (b) N =10. Note that the batch is said to complete when every job in the batch has completed. Also note that the number of processors that leads to the minimum and maximum values of the batch completion time may be different from one another
Step by Step Solution
There are 3 Steps involved in it

Get step-by-step solutions from verified subject matter experts