

Question: 1. Consider the data 1, 3, 5, 7, 9, 11 and 13. Store them in L, and then (a) Find . (b) Find o.
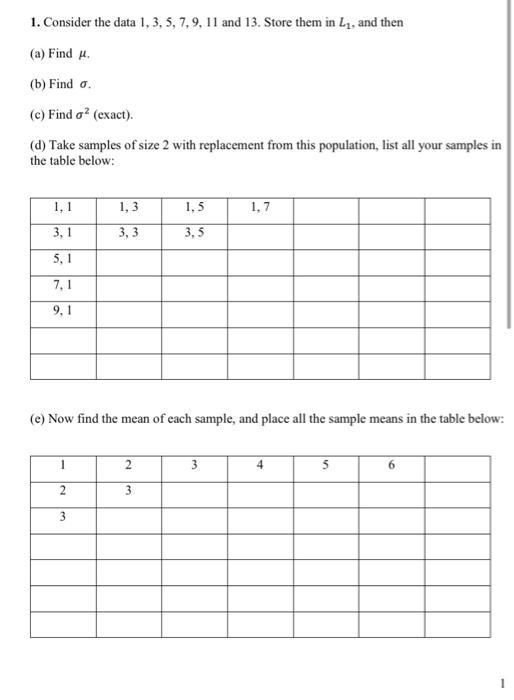
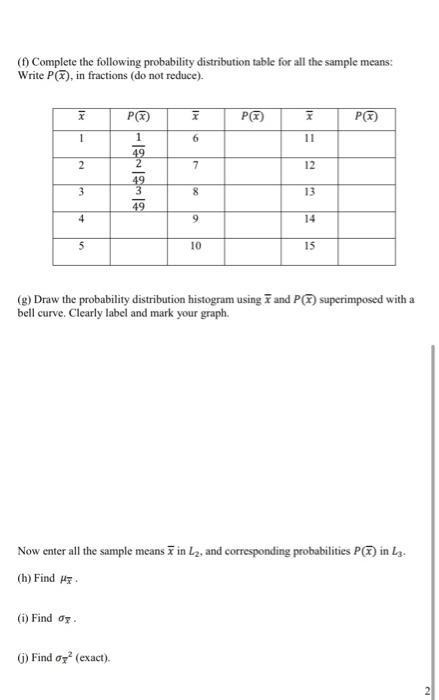
1. Consider the data 1, 3, 5, 7, 9, 11 and 13. Store them in L, and then (a) Find . (b) Find o. (c) Find a (exact). (d) Take samples of size 2 with replacement from this population, list all your samples in the table below: 1, 1 3,1 5,1 7,1 9,1 1 2 1,3 3,3 3 (e) Now find the mean of each sample, and place all the sample means in the table below: 1,5 3,5 2 3 1,7 3 4 5 (f) Complete the following probability distribution table for all the sample means: Write P(x), in fractions (do not reduce). X 1 2 (i) Find o 3 4 5 P(X) 1 - (1) Find oy (exact). 49 2 49 49 111 6 7 8 9 10 P(X) 7 11 12 13 14 15 (g) Draw the probability distribution histogram using and P(x) superimposed with a bell curve. Clearly label and mark your graph. P(X) Now enter all the sample means in L2, and corresponding probabilities P(x) in L.3. (h) Find g.
Step by Step Solution
3.52 Rating (152 Votes )
There are 3 Steps involved in it
Solution a 6 x1 C c e 11 31 51 deta 13 5791113 13 5781113 81216 4 71 ... View full answer

Get step-by-step solutions from verified subject matter experts