

Question: 1.) Consider the data in the table below for three independent health services organizations: Revenues Total Variable Costs Fixed Costs Total Costs Profit a. $2,000
1.) Consider the data in the table below for three independent health services organizations:
Revenues Total Variable Costs Fixed Costs Total Costs Profit
a. $2,000 $1,400 ? $2,000 ?
b. 1,000 ? 1,600 $2,400
c.4,000 ? $600 ? 400
2.) Assume that a radiologist group practice has the following cost structure:
Fixed costs $500,000
Variable cost per procedure $25
Charge (revenue) per procedure $100
Furthermore, assume that the group expects to perform 7,500 procedures in the coming year.
a. Construct the groups base case projected P & L statement.
b. What is the groups contribution margin? What is its breakeven point?
c. What volume is required to provide a pretax profit of $100,000? A pretax profit of $200,000?
d. Sketch out a CVP analysis graph depicting the base case situation.
e. Now assume that the practice contracts with one HMO, and the plan proposes a 20 percent discount from charges. Redo questions a, b, c, and d under these conditions.
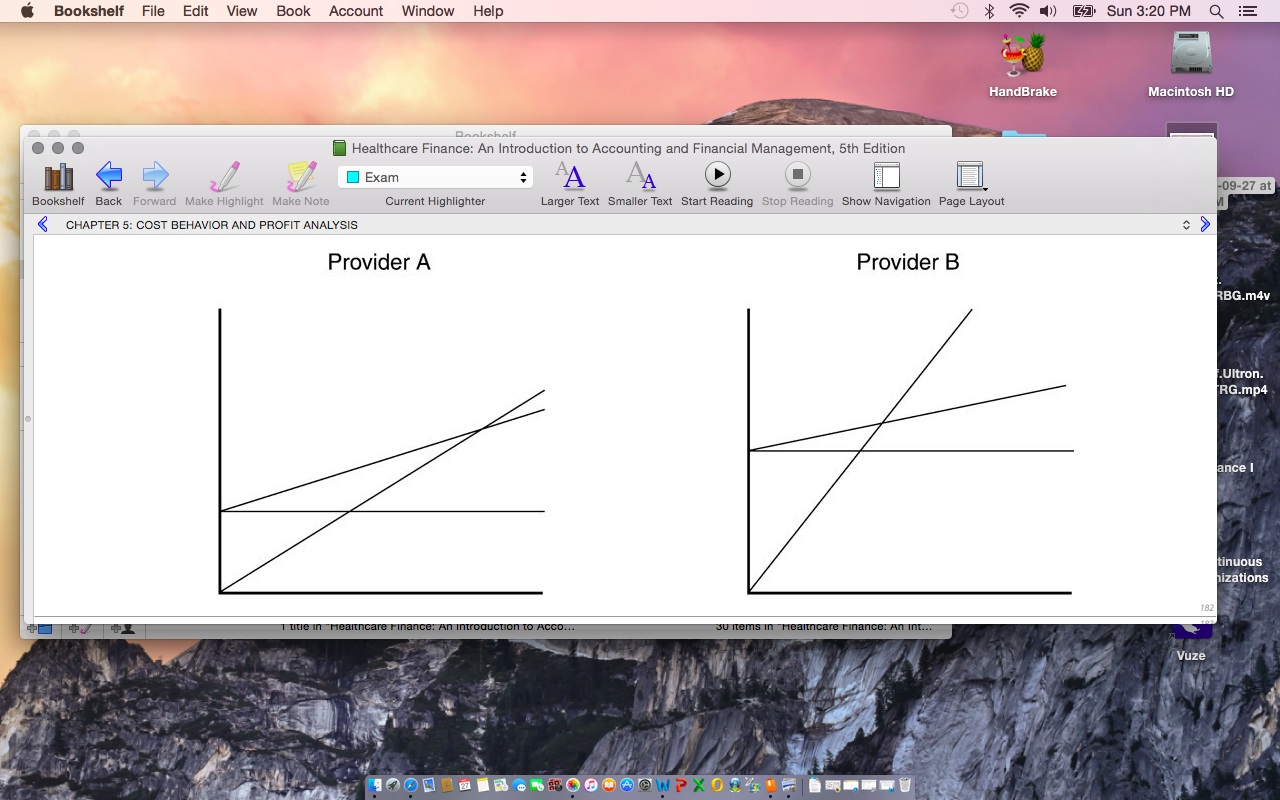
3.) ?Consider the CVP graphs below for two providers operating in a fee-for-service environment:
A. Assuming the graphs are drawn to the same scale, which provider has the greater fixed costs? The greater variable cost rate? The greater per unit revenue?
B. Which provider has the greater contribution margin?
C. Which provider needs the higher volume to break even?
D. How would the graphs below change if the providers were operating in a discounted fee-for-service environment? In a capitated environment?
Step by Step Solution
There are 3 Steps involved in it

Get step-by-step solutions from verified subject matter experts