

Question: 1. Consider the data set shown in Table below: Instance A B C Class 0 0 1 1 0 1 1 0 1 10 1
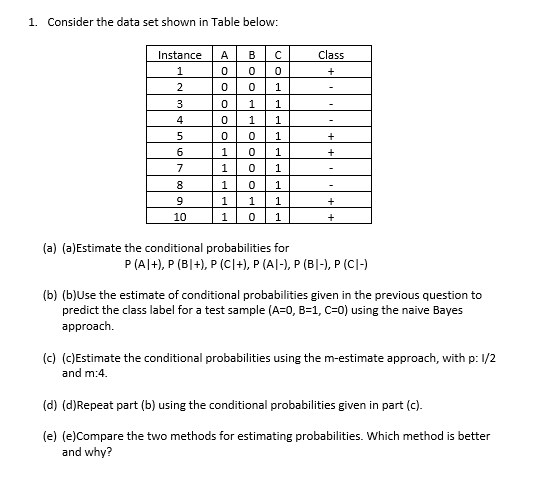
1. Consider the data set shown in Table below: Instance A B C Class 0 0 1 1 0 1 1 0 1 10 1 0 1 (a) (a)Estimate the conditional probabilities for P (Al+), P (BI+), P (CI+), P (Al-), P (BI-), P (CI-) (b) (b)Use the estimate of conditional probabilities given in the previous question to predict the class label for a test sample (A-o, B-1, C:0) using the naive Bayes approach. (c) (c)Estimate the conditional probabilities using the m-estimate approach, with p: I/2 and m:4 (d) (d)Repeat part (b) using the conditional probabilities given in part (c) (e) (e)Compare the two methods for estimating probabilities. Which method is better and why
Step by Step Solution
There are 3 Steps involved in it
1 Expert Approved Answer
Step: 1 Unlock

Question Has Been Solved by an Expert!
Get step-by-step solutions from verified subject matter experts
Step: 2 Unlock
Step: 3 Unlock