

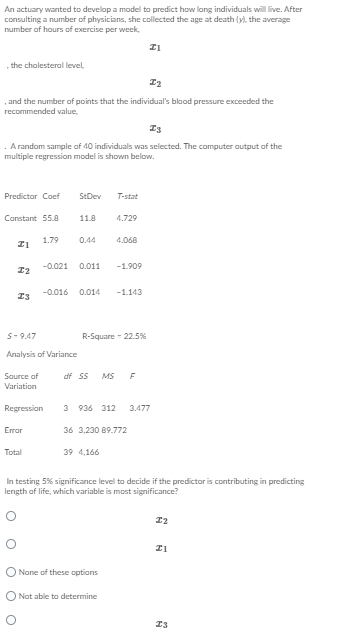
Question: 1. Consider the following hypotheses and accompanying sample data drawn independently from normally:r distributed populations. HI]: #13112 versus Ha: ,u1 : Ag with a p-value
![from normally:r distributed populations. HI]: #13112 versus Ha: ,u1: Ag with a](https://s3.amazonaws.com/si.experts.images/answers/2024/06/667a961be4c46_851667a961bd36ed.jpg)


1.
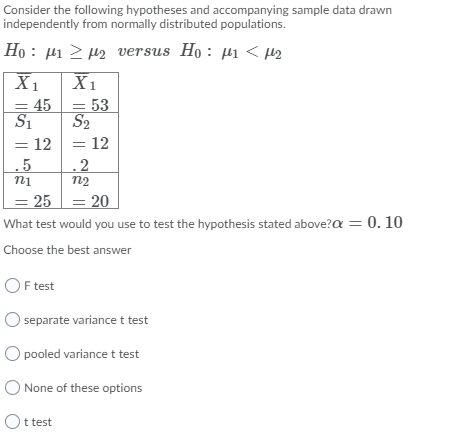
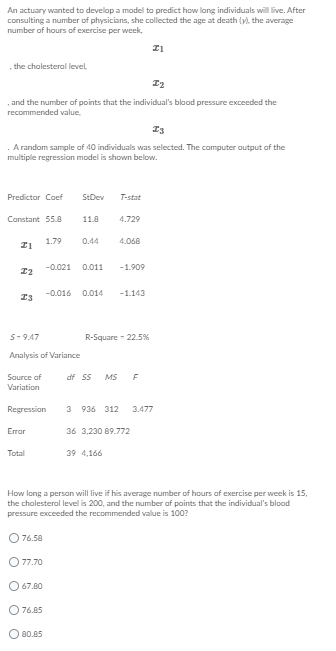

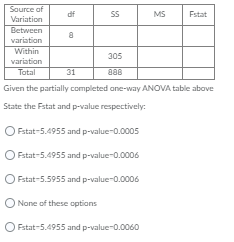

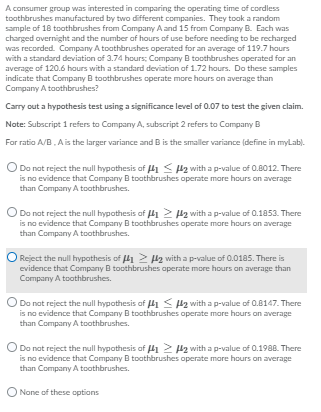
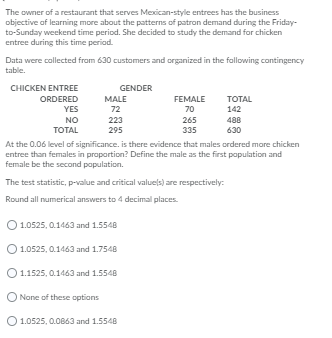

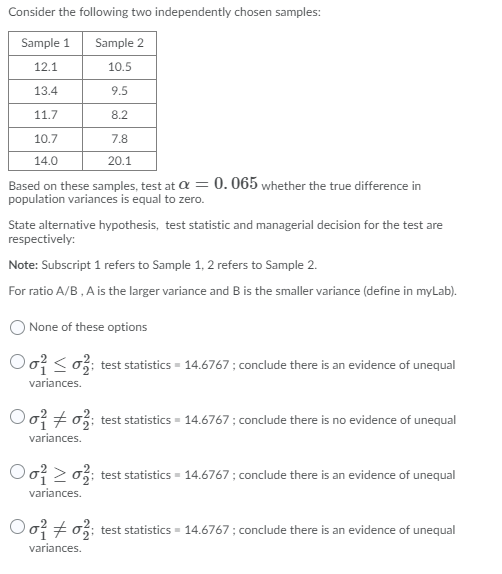


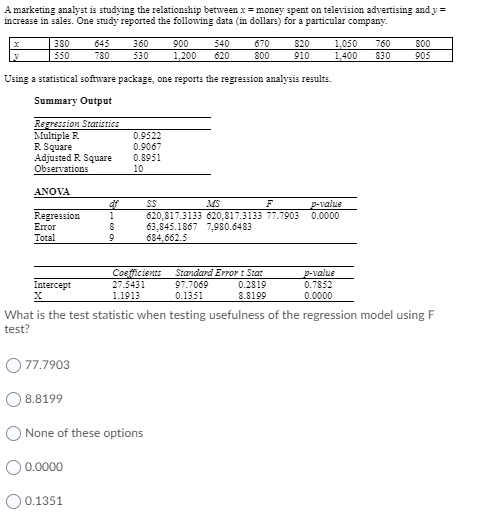
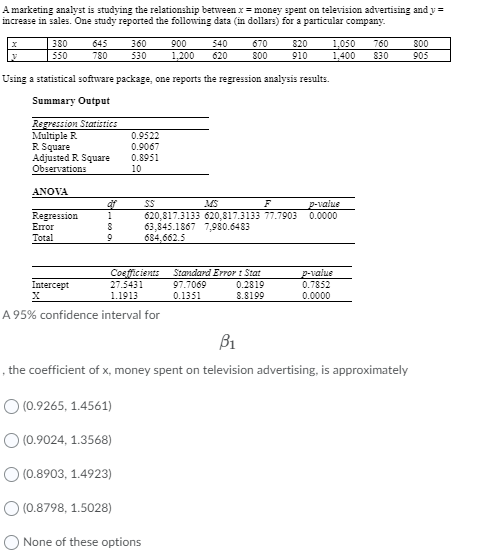
Consider the following hypotheses and accompanying sample data drawn independently from normally:r distributed populations. HI]: #13112 versus Ha: ,u1<: what test would you use to best the hypothesis stated abovel z choose answer o f separate variance t pooled none of these options consumer group was interested in comparing operating time cordless toothbrushes manufactured by two different companies. they took a random sample from company and b. each charged overnight number hours before needing be recharged recorded. operated for an average with standard deviation b hours. do samples indicate that operate more on than carry out using significance level given claim. note: subscript refers ratio . is larger smaller mylab not reject null ag p-value there no evidence toothbrushes.>: Ag with a p-value of 0.0185. There is evidence that Company B toothbrushes operate more hours on average than Company A toothbrushes. (Do not reject the null hypothesis of /1 . My with a p-value of 0.8147. There is no evidence that Company B toothbrushes operate more hours on average than Company A toothbrushes. ()Do not reject the null hypothesis of /1 > q with a p-value of 0.1908. There is no evidence that Company B toothbrushes operate more hours on average than Company A toothbrushes. None of these optionsConsider the following two independently chosen samples: n Based on these samples.test at {I I D. 065 whether the true difference in population variances is equal to zero. State alternative hypothesis. test statistic and managerial decision for the test are respectively: Note: Subscript 1 refers to Sample 1, 2 refers to Sample 2. For ratio AJB . A is the largervan'ance and B is the smaller variance {define in vaab}. 0 None of these options 0 0'? E 0'3; test statistics I 14.6767 : conclude there is an evidence of unequal variances. O 0'? 75 0'3: test statisdcs I 14.6767 : conclude there is no evidence of unequal variances. O 0'? 2 0'3; test statistics I 14.6767 : conclude there is an evidence of unequal variances. O 0'? 75 0'3: test statisdcs I 14.6767 : conclude there is an evidence of unequal variances. \fIn April of 2019. the unemployment rate in Canada was reported to be 6.8%. Suppose that Statistics Canada claims that the current unemployment rate is lower than that oprril 2019. Suppose a test was conducted on current unemployment and a random sample size of 1000 and found unemployment at 62%. Test an appropriate hypothesis and state your conclusion. (I = 0. DB Rounded to 4 decimal places. 0 Ho : 1r 3 0. 068 versus Ha : 1r U. 68 -. test statisticsI 0353?. P- value I 0.??45. This data shows evidence that the unemployment rate has decreased since April of 2019. CEO : 7r 3 . 3 versus H : 7:
Step by Step Solution
There are 3 Steps involved in it

Get step-by-step solutions from verified subject matter experts