

Question: 1. Consider the following plot of data points for two classes x and o based on two features x1 and x2 : (a) Draw the
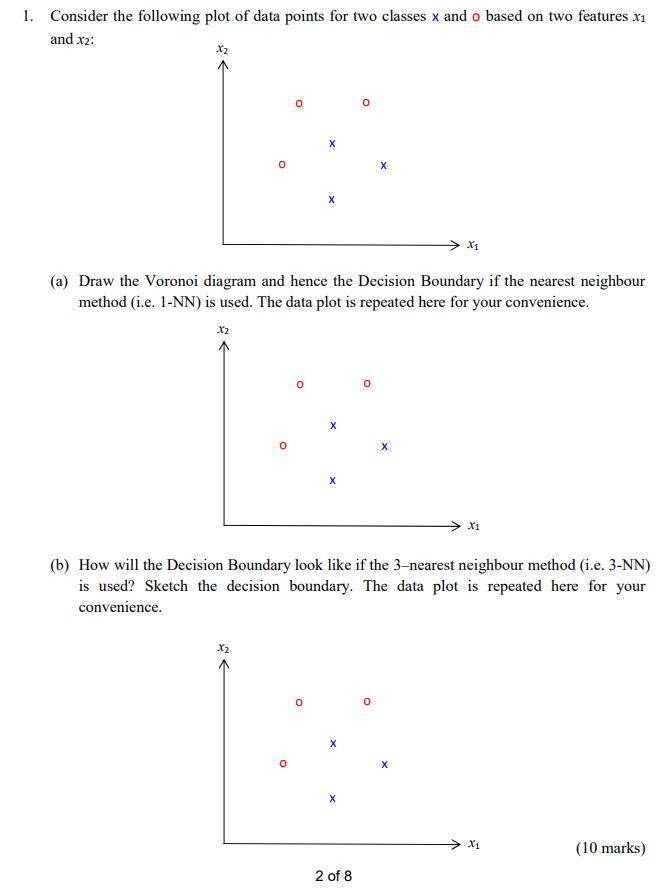
1. Consider the following plot of data points for two classes x and o based on two features x1 and x2 : (a) Draw the Voronoi diagram and hence the Decision Boundary if the nearest neighbour method (i.e. 1-NN) is used. The data plot is repeated here for your convenience. (b) How will the Decision Boundary look like if the 3-nearest neighbour method (i.e. 3-NN) is used? Sketch the decision boundary. The data plot is repeated here for your convenience. (10 marks)
Step by Step Solution
There are 3 Steps involved in it
1 Expert Approved Answer
Step: 1 Unlock

Question Has Been Solved by an Expert!
Get step-by-step solutions from verified subject matter experts
Step: 2 Unlock
Step: 3 Unlock